Choosing a New Cleaning Product Based on Environmental, Health and Safety Issues
Performance of an alternative is not the only selection criterion that needs to be addressed when looking for a new cleaning product. The determination of a product’s overall risk is based on five environmental indicators: volatile organic content, global warming potential, ozone depletion potential, flammability/reactivity and toxicity/carcinogenicity.
Traditional solvents have known Environmental, Health and Safety (EH&S) effects, which has led to the development of alternative chemical formulations. The toxicity, flammability and smogproducing effects of petroleum-based solvents were distinguished from an early date. The chlorofluorocarbons (CFCs) were designed for the replacement of the petroleum solvents but despite being some of the most useful classes of compounds ever synthesized, the chemical stability of CFCs resulted in a long atmospheric residence times. This allowed these chemicals to slowly mix in the upper atmosphere where they dissociate, freeing chlorine atoms catalyzing the destruction of the earth’s protective ozone layer.
Shifting Risk
The most important consideration when choosing an alternative is to not shift the risk involved in the process. For example, when attempting to replace a flammable solvent, it would not be advantageous to select an ozone depleting chemical. In this case, the risk goes from the worker (burn, explosion, etc.) to the environment (ozone destruction). Ideally, a selection of an alternative cleaning product should be safer for one or the other, or if possible a product that would result in a reduced risk for both.Indicators
Until recently, replacement of these solvents had been on a case-by-case basis and a systematic, scientific approach had been generally lacking. TURI established its lab in order to address this deficiency.Over time, the SSL selected the following characteristics for its screening criteria: volatile organic content (VOC), global warming potential (GWP), ozone depletion potential (ODP), flammability/reactivity and toxicity/carcinogenicity. These indicators were then incorporated into the lab’s online database of testing results of cleaning products, www. CleanerSolutions. org. To this end, the CleanerSolutions environmental screening was designed to use values for VOC, GWP, ODP, NFPA ratings (or HMIS ratings) and pH. Each alternative product in the database gets evaluated and assigned a Safety Screening Score. The screening score is based on 50 points, 10 point maximum for each parameter listed. A higher safety screening score implies a potentially safer product.
Elimination of Solvent Exposure in Surface Cleaning
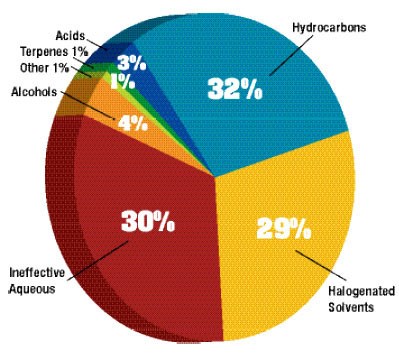
The focus of SSL has been to replace hazardous solvents with a special focus on the halogenated hydrocarbons. About 30 percent of the trials conducted at SSL have been to identify replacements for halogenated solvents. An additional 30 percent were conducted to replace hydrocarbon-based solvents (toluene, MEK, N-methyl-2-pyrollidone, etc.). Perhaps one of the more interesting developments in solvent assessment at SSL has been the request to replace ineffective aqueous-based cleaning formulations. Nearly as many aqueous-based solvents were replaced as the halogenated solvents. Figure 1, displays the chemical types that have been replaced by testing at SSL.Safety Screening Score
As mentioned previously, the Lab uses five criteria for screening products, and nearly every product that has been entered into the database has been assessed using these indicators. A review of each screening indicator was conducted to determine acceptable and unacceptable levels in cleaning formulations.Volatile Organic Compounds (VOCs)
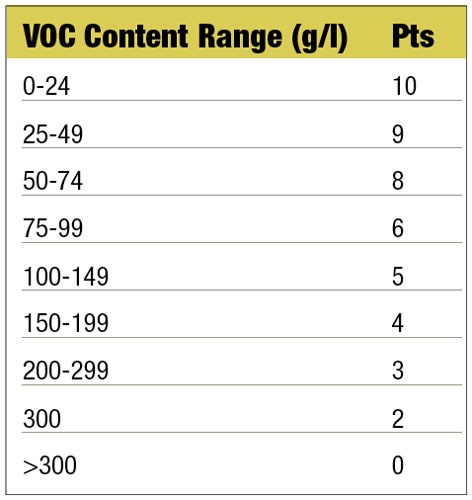
There are thousands of different VOCs produced and used daily. They can cause several acute and chronic damages to exposed workers. For example, acute or short-term exposure can lead to eye irritation/watering, nose irritation, throat irritation, headaches, nausea/vomiting, dizziness or asthma exacerbation. Chronic or long-term exposure can result in the development of cancer, liver damage, kidney damage or central nervous system damage. In addition, VOCs have been associated with poor air quality and the formation of smog. Many regions have set stringent levels for VOC content in products. From this information, a safety screening protocol was established for VOC and is listed in Table 1.Global Warming Potential (GWP)
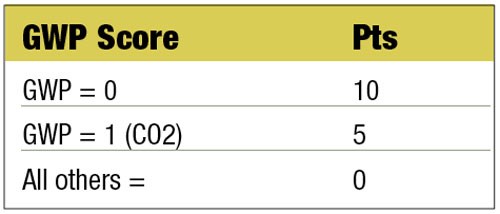
This indicator is used to compare the ability of different greenhouse gases to trap heat in the atmosphere and is based on the heat-absorbing ability of the gas relative to the base chemical carbon dioxide (CO2). The decay rate of each gas is related to CO2. Some greenhouse gases occur naturally in the atmosphere, which includes water vapor, carbon dioxide, methane, nitrous oxide and ozone. There are others that result from human activities and are very powerful greenhouse gases. Typically these are generated in a variety of industrial processes, including cleaning processes. The range for the GWP indicator values are listed in Table 2.Ozone Depletion Potential (ODP)
The ozone layer screens out the sun’s harmful ultraviolet radiation. Small amounts ofozone are constantly being made by the action of sunlight on oxygen. At the same time,
ozone is being broken down by natural processes. In an ideal situation, the total amount of
ozone usually stays constant because its formation and destruction occur at about the same
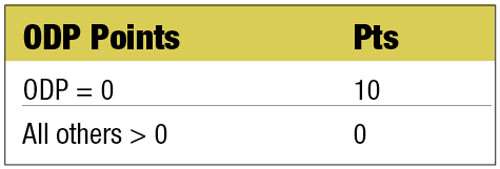
rate. However, human activity has recently changed that natural balance. Certain manufactured substances can destroy stratospheric ozone much faster than it is formed. Ozone depletion potentials were established and based on the ratio of the amount of ozone depletion of a chemical compared to the amount of ozone depletion of the same mass of CFC-11. Being one of the Lab’s initial driving forces, the ODP screening criteria has been set at all or nothing as shown in Table 3.
National Fire Protection Association/Hazardous Information Systems (NFPA/HMIS)
The NFPA’s mission of the international nonprofit organization is to reduce the burden of fire on the quality of life by advocating scientifically- based consensus codes and standards, research, and education for fire and related safety issues. The NFPA/HMIS rating system was originally intended to provide basic background information to emergency personnel, enabling them to more easily decide how to handle the chemicals in case of an emergency. The system has also proven to be very useful in the chemical industry.The second hazard identification system generally used was developed by paint manufacturers (National Paint and Coating Association) to address situations more common to their environment than the situations encountered by firefighters. The two systems have three common areas of focus that were used in SSL’s safety screening process. These include health, fire and reactivity. Each category is assigned a number from 0 to 4 based on the hazard level with 0 being a minimal hazard and 4 being a severe hazard.
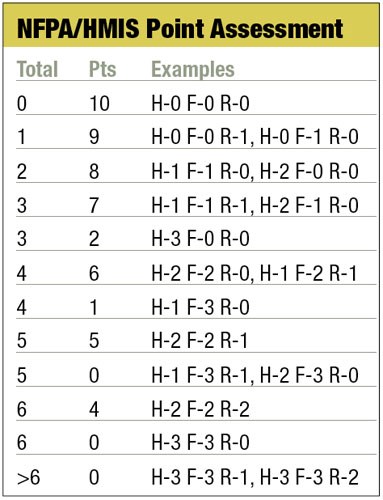
The Lab’s safety screening scoring was derived by taking the three categories associated with either NFPA or HMIS and adding up the numbers to get a total number. This summed number is then assigned a safety screening value. To illustrate, for a product that has a HMIS of H:1 F:1 and R:1 a total number of 3 would be used to assess the safety screening value of 7 to the product in this criteria. For a product that has any category with a 3 in it, a lesser point value would be added. For a product with a H:3, F:0 and R:0, the total number would be 3, but the environmental point assigned would be 2 due to the severity of the effects of a ranking of 3 carries with it. Various combinations are depicted in Table 4.
pH
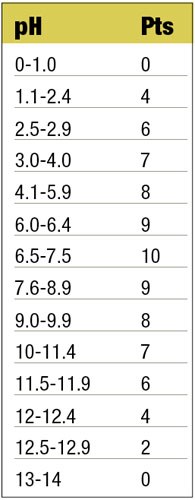
The last safety screening score parameter used by SSL is pH. This value provides a measure on a scale from 0 to 14 of the acidity or alkalinity of a solution. Products are considered to be neutral at a pH of 7, acidic below 7 and basic above 7. In cleaning applications, pH values should fall above 3 (strong acid) and below 11 (very basic, likely to cause corrosion and/or tissue damage). Therefore, the pH safety screening value would receive higher scores for values closer to neutral. The pH ranges/screening scores were established based on the available products and are listed in Table 5.Example Safety Screening Score
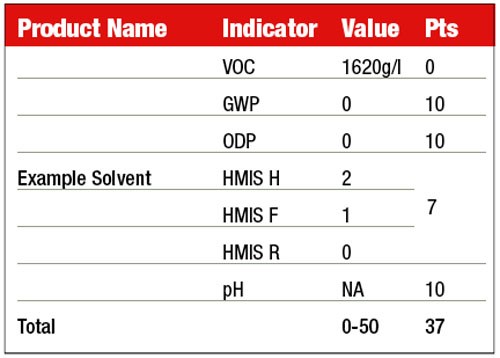
Figure 2 displays an example of a completed safety screening score based on the proposed system. The VOC levels were above the 300 g/l level and would receive no points. There were neither GWP nor ODP levels and the solvent would receive ten points for each category. The product had an HMIS Health rating of 2 and a rating of 0 for both flammability and reactivity. Therefore, the product would receive 8 points for this screening criterion. This solvent had no associated pH value and would receive the max rating for this category. Adding the five safety screening areas together results in a safety screening score of 38.Safety Screening Scores and Selection of Products
The safety screening process was applied to more than 500 alternative cleaning formulations and compared to the scores of the solvents that the alternatives would replace. Amajority of the alternative products evaluated at the lab have had a safety score of at least 37. This value was significant because during an assessment of solvents replaced, the score was found to be the upper end of the screening scores of the solvents to be replaced. Thus, the fact that most products selected as an alternative would have a greater chance of improving upon EH&S with a safety screening score at or above this value. Additionally, the average alternative product safety screening score was calculated to be 41.Once you have selected alternative products based on laboratory performance and an initial safety screening using the CleanerSolutions database, you should conduct more indepth research. For performance, remember that cleaning varies from case to case. SSL recommends process specific testing on potential replacement cleaning chemicals. For safety, further analysis should be conducted to verify that the selected products are compatible with your process and to determine if there are any health risks that the screening does not address. Some areas to look at are included in Table 6.
Toxics Use Reduction Institute’s P2 Option Assessment System
The Institute previously had developed a systematic tool that helps companies determine whether the TUR options they are considering may have unforeseen negative environmental, worker or public health impacts. P2OASys allows companies to assess the potential environmental, worker and public health impacts of alternative technologies aimed at reducing toxics use. The goal is more comprehensive and systematic thinking about the potential hazards posed by current and alternative processes identified during the TUR planning process.Assessment of Screening Methodology to P2OASys
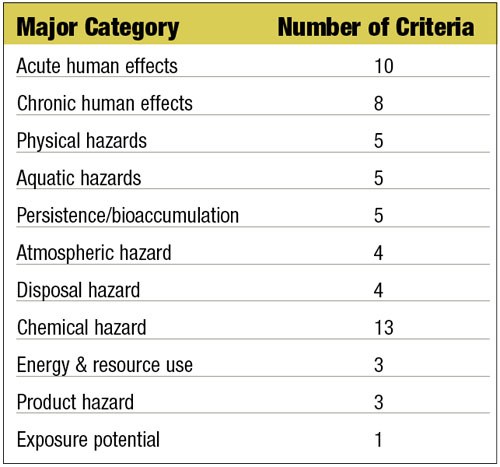
To determine how well the SSL Safety Score Screening system was at rating safety for workers and the environment, a comparison to an established EH&S tool was needed. P2OASys was selected based on its comprehensive list of criteria used to evaluate potential products to one another through a systematic protocol. The tool looks at a possible 61 criterion. The general areas covered in this tool are listed in Table 7.The first step taken in the comparison of CleanerSolutions screening tool with P2OASys was to establish which products to include in the evaluation. Products were divided into classifications that have been used by the cleaning industry. These groupings included four types of aqueous based products, organic solvents, terpenes, hydrocarbons, halogenated and replaced solvents (typically chlorinated solvents). Some of the classifications used could be considered to be sub categories of the selected product types. However, due to the number of products in each of these sub groups and variation in safety levels within larger groupings, the specific smaller categories were used for the analysis.
Products were selected from within each group randomly. Based on statistical analysis of environmental samples, a decision was made to evaluate six products from each category. Through the selection process, more than 100 products were compared.
Material safety data sheets (MSDS) and other product literature pieces (technical data sheets, independent testing reports, etc.) were then collected. For products where no literature could be found, a replacement product was selected from within the same product category. The MSDS was the preferred sources used for the data collection required in the P2OASys analysis. Furthermore, in certain cases the P2OASys tool calls for expert judgment in assigning certain risk factors and levels that couldn’t be obtained from a MSDS. In these instances, the values were entered based on the lab’s experience and knowledge in the resulting areas in question.
Not every category was used in the P2OASys assessment for each product. Values that
were entered for each criterion followed the guidelines provided by the P2OASys tool. An
average of 29 criteria was used per product with a low of 15 and a maximum of 37 criteria.
The total resulting score is based on 10 points, averaged on the number of criteria used. The lower the score, the safer the products were.
After the entire collection of data was run through P2OASys, the criteria based on only
the five indicators used in the CleanerSolutions safety screening methodology were entered
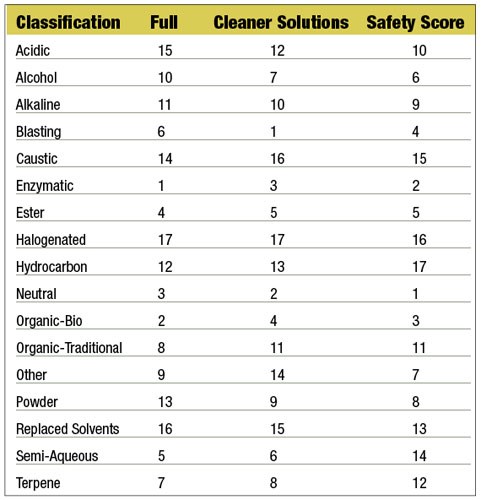
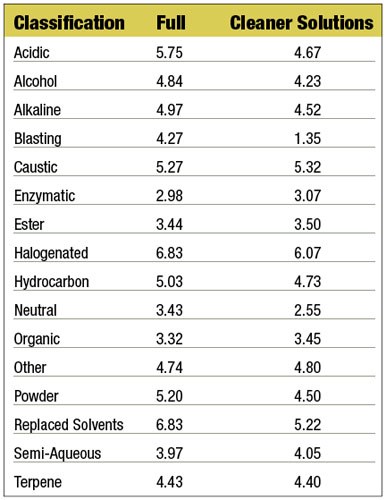
into the P2OASys and a second set of ratings were calculated. Both the full and partial
P2OASys scores are listed in Table 8.
Ranking by P2OAsys and Cleaner Solutions Safety Screening Score
To compare the CleanerSolutions’ safety screening value (based on 50 points, higherscores having potentially safer implications) directly to the P2OASys values obtained (based on 10 points with lower scores having potentially safer implications), each classification was ranked from 1 to 16, with 1 being the best. The rankings were based on the resulting score calculated from the various data. Rankings for the full, partial and Safety Screening Scores are listed in Table 9.
When comparing the P2OASys scoring system to the CleanerSolutions Safety Screening
Score, many of the product classifications were ranked very similarly. Five of the seventeen
categories were within 1 ranking position (nearly 30 percent). More than half of the classifications— nine—were within two ranking positions (52 percent). The largest difference in rankings came from the semi-aqueous classification, a difference of nine ranking positions.
No classifications were ranked identically between the two systems. Furthermore, the
safety screening score had almost as many classifications ranked lower than the P2OASys
method as it had above the more comprehensive method. Individual P2OASys scores
calculated using the CleanerSolutions safety screening criteria resulted in lower scores than
the full P2OASys assessment in more than 60 percent of the products. The lower scores
would indicate a safer product than if the assessment was conducted using the expanded set
of evaluation criteria. Yet, when looking at the overall rankings by classifications, there is no significant loss in safety when screening using the CleanerSolutions Safety Screening system.
Summary of Assessment of Safety Screening Methodology
The analysis of the effectiveness of the five criteria for screening out hazardous productswas shown to be an acceptable measure. The comparison to the more comprehensive
process, P2OASys, revealed that the five indicator combination value rated products in
similar manner as when using the possible 61 criteria. The small set of data points did tend
to rank some of the product classifications as being safer than with a more comprehensive
number of criteria, but not enough to make the screening tool ineffective.
In his role as the University of Massachusetts Lowell Toxics Use Reduction Institute’s
(TURI) Director of Laboratory Services, Jason Marshall develops and implements surfaces
cleaning research project goals and plans. He is responsible for marketing laboratory
services to Massachusetts industry and other customers. Recent projects include a TURA
program-wide effort to promote adoption of alternatives to trichloroethylene (TCE) for
businesses in Massachusetts. He is currently a doctoral candidate at the University of
Massachusetts Lowell’s Work Environment program. He can be reached at (978) 934-3133.
RELATED CONTENT
-
Pretreatments: The Next Generation
Emerging technologies can save energy, ease environmental concerns
-
Development of a Sustainability Metrics System and a Technical Solution Method for Sustainable Metal Finishing: AESF Research Project #R-121, 6th Quarterly Report
The NASF Research Board has funded a research grant at Wayne State University on sustainability in the surface finishing industry, under the direction of Professor Yinlun Huang. The objective of the work is to create a surface-finishing-specific sustainability metrics system to measure economic, environmental and social sustainability. In this report, a benchmarking study of five plants was undertaken to illustrate how the sustainability assessment works.
-
Chemical Milling Environmental Improvements, Aerospace is Green and Growing
By David Tomlinson and James Wichmann, AC Products Inc.

