Efficient Electrocoat Tank Operation
To prosper in today’s economic climate, Electrocoaters must be dedicated to never-ending improvement in quality and productivity.
To prosper in today’s economic climate, Electrocoaters must be dedicated to never-ending improvement in quality and productivity. Because customers want higher quality at a lower price, Electrocoaters must seek more efficient ways to produce coated parts, consistently, in order to meet these customer's needs. I have heard these or a variation of these statements a lot lately but what do these statements mean?
Electrocoating is a very efficient process. It’s automated, has high transfer efficiency and features a rinse system to reclaim lost paint: What could be better? Well, things can be better, but enabling change requires planning and training. The efficiency of an electrocoat process can be improved in many ways such as changing paints, installing new equipment and changing racking—just to name a few. But the best or first place to start improving the efficiency is with statistical process control or SPC. Unfortunately, SPC can be viewed as a bad word and even feared but when used properly it is very effective.
Featured Content
Basically, SPC is a method of monitoring, controlling and, ideally, improving a process through statistical analysis. Its four basic steps include: measuring the process, eliminating variances in the process to make it consistent, monitoring the process and improving the process to its best target value. The purpose of this article is not to go into detail about using SPC, but to show how to apply it to the electrocoat process. To learn more about SPC, there are numerous books, software and training courses available.
Most Electrocoaters say that their process is in control. In reality, a fair number of Electrocoaters control their process. Is there a difference between a process in control and controlling the process? A process that’s in control reduces and controls any variation in the process to improve consistency. A process that is controlled compensates for the variation to overcome inconsistency. Here is an example:
Coating Shop A wants to apply the correct film build to a part but can not achieve the minimum spec consistently. So, in order to obtain the minimum film build on all parts, more film is applied to some parts. Controlling a system in this manner results in more paint being applied than necessary. This type of control occurs frequently and has even become an acceptable practice in some shops. So how do you get the process in control?
An electrocoat process has many variables that need to be controlled in order to consistently produce a quality part. The main variables that need to be controlled are:
- Main Bath % Solids
- Main Bath Temperature
- Main Bath pH
- Main Bath Conductivity
- Main Bath Tank Level
- Main Bath p/b
- DI or RO Water Conductivity
- Anolyte Conductivity
- UF Flux Rate
- Rinse % Solids
- % Solids to Drain
- Film Build
The above list is not all of the variables in an electrocoat system, but contains the main ones with which to start. All the variables, except UF Flux Rate, % Solids to Drain and Film Builds are charted on Individual Moving Range charts. UF Flux Rate and % Solids to Drain are done on trend charts. Film Builds are charted on an X R chart. Individual Moving Range charts plot individual readings where as an X R chart plots the average of a group of readings. The readings on an electrocoat system are generally single points; one reading per sample which is why an Individual Moving Range chart is used. X R charts can be used but they can actually hide some variations in the process. Charts are a visual representation of how well the process is performing. The type of chart used needs to reflect what is happening in the process. Single readings need to be plotted as such and not grouped together.
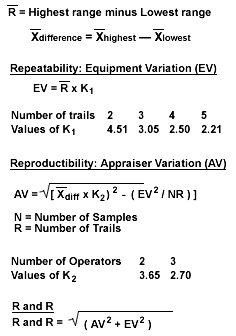
The first step to starting SPC is to do a Gage Repeatability and Reproducibility (R and R) study on the equipment used to take the measurements. Repeatability is the ability of an operator using a single gage to obtain the same measurements during a series of tests. Reproducibility is the ability of different operators to obtain similar results with the same gage. GAGE R and R blends these two factors together to determine a measuring system’s reliability, and its suitability for a particular measuring application. There are several methods that can be used to determine Gage R and R, the short method, the long method or X R and ANOVA. I use a version of the long method for electrocoat, illustrated below:
Gage R and R—The Long Method:
Prepare one electrocoat sample. More than one sample can be used but I have had good results using just one. Make sure the sample is representative of the paint, normal pH, conductivity, etc. Have each operator take five readings from the sample. The readings should be done separately and following the same procedure used on a normal basis. Calculate the average, or X, for each operator’s set of readings. Calculate the range, highest reading minus the lowest reading for each operator. Determine R and R using the following equations.
Guidelines for acceptance of Gage R and R
- Under 0.10 is okay,
- 0.10-0.30 is acceptable but work to improve. Plot the data and review. Are the data points all over the place? Inconsistent data could be a sign of a bad gage. Is there a difference between the operators? Differences between the operators could be due to technique or procedure.
- Over 0.30 is unacceptable and needs to improve.
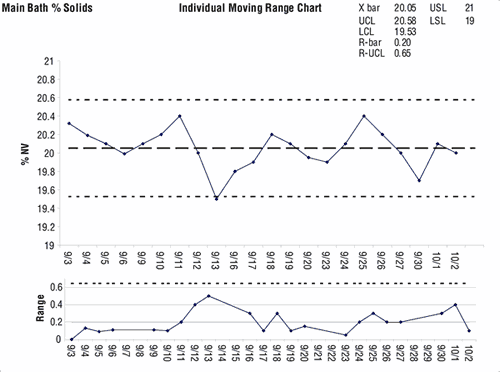
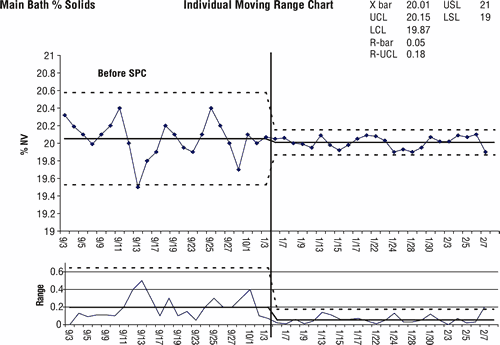
After the Gage R and R is complete, it's time to start charting. If the Gage R and R was okay, you can use previously gathered data. If the R and R was unacceptable and changes have been made, you need to start from the point where the changes were made. Plot the data on charts, I prefer charts that are done by hand, not generated on a computer. In addition, the operator taking the readings should plot the data. Operators run the system and can react more quickly to conditions than somebody removed from the system. After 20 points, calculate X, Upper Control Limit (UCL) and Lower Control Limit (LCL) using the formulas for the type of chart being used. Once the Control limits X and are placed, review the charts. Remember, charts are a visual representation of how well your process is performing. If the charts are all over the place and there are points outside the control limits it is time for improvement. Don’t be surprised if the charts look bad, they usually do the first time. I ran an electrocoat system for a couple of years before applying SPC. I thought the system was performing well, every check was within the specifications. SPC was just something else that would have to be done. The first time I looked at the initial charts, it was eye opening. The data was all over the map with numerous points outside the control limits. The initial chart for Main Bath % Solids is illustrated in chart 1.I realized then that maybe SPC was a good thing and began making changes. The process improved and mysterious problems that had happened in the past began to go away. The coating became more consistent with fewer problems and the system was easier to run. The same chart after the changes is illustrated in chart 2.
Chart 2 is a big improvement over chart 1. The system was not perfect, but had improved significantly. There were many changes that went into making improvement. In addition, the changes made to solids had an effect on other charts and vice-versa. That was a key learning point from this project—electrocoat bath parameters are all related and you need to develop changes with that in mind.
Electrocoat parameters are all related. If you change one, others will be affected. There needs to be a methodology to making improvements. The following paragraphs outline what can be done to improve each of the parameters, which I recommend to chart. The parameters are in the order that they should be addressed.
Main Bath % Solids:
The Main Bath % Solids has an effect on the most parameters and should be undertaken first. Controlling the % solids will have an effect on the pH, conductivity and p/b. In addition, the main bath % solids can effect UF flux rate, rinse % solids and % solids to drain depending on how the fresh feed is introduced into the system.
The best method for controlling the main bath % solids is to replace the paint as it is depleted. There are two methods for replacing the paint as used, continuously feeding or batch feeding in a timely manner. Batch feeding is more practical than continuos feeding and should be used in most cases. A Batch feed system feeds a set amount of paint into the tank at certain intervals. Racks, parts or amp-hours can control the intervals. If every rack has the same number of parts on it, feeding by rack or a set number of racks is good. If parts are hung individually and the parts are similar in size, feed by part or parts. Most shops do not run racks that have all the same amount of parts or parts that are the same size; they run a mix of everything. Amp-hours are a count of how many amps a rectifier has supplied. The amount of amps used is a direct correlation to the amount of paint used. So, feeding by amp-hours is generally the most practical way to feed an electrocoat system if the part load is not consistent. A batch system should feed the tank every 10-15 min. The amount of feed fed at intervals smaller then 10 min are usually too small for the pump to consistently deliver. The pump in a batch feed system should match the amount of feed that will be fed. A 10 gpm pump cannot feed five gallons very accurately. A positive displacement pump works well with a batch system. A batch feed system needs to be checked regularly to make sure that the correct amount of feed is being fed. The best method to check the accuracy of a feed system is to plot how much has been fed versus what should have been fed. Check the accuracy daily at first and adjust as needed. After the system is stable, feeding what is required consistently, check weekly.
Main Bath Tank Level:
The main tank bath level should be tackled at the same time as Main Bath % Solids. The level of the tank does affect the solids reading. A low tank level increases the solids and a high tank level decreases the solids. Tank level can be thought of as a dilution indicator. The higher the level the more dilute.
The best way to control tank level is to add water on a regular basis, similar to the feed. The water should be added to the rinse system. Water does not have to be added as regularly as feed but should be done more often then once per shift. The amount of water needed is related to the amount of feed that has been fed. Plot the amount of water added per day versus the amount of feed added per day. Be sure that the amount of water added for purging is included. The amount of permeate that is purged to control conductivity will relate to the amount of feed in a system that is in control. Calculate the amount of water that is needed per feed. Feed water into the system based on the amount of paint that has been fed and the tank level. You do not want to over flow the tank, so check the tank level before each water addition. Add the water slowly through a gallon counter or a batch meter. A batch meter can feed a set number of gallons then shut off, you do not have to stand by and monitor the amount of water added.
The amount of water added to the control tank level will change as the system becomes more in control. So continually recalculate the amount of water needed per feed. In addition, weather conditions will affect the amount of water needed. In the summer more water will be needed than in winter, due to evaporation, especially if the temperature of the rinses is not controlled.
Main Bath Temperature:
The main bath temperature is often over looked because it is automatically controlled. Automatic control can be deceiving; there are different types of controllers. What might be considered in control for one process might not be for another. The two main types of controllers for temperature on an electrocoat tank are differential and proportional. Differentials are off and on controllers; they turn on at a set temperature and turn off at another. The off and on points are usually plus or minus a set number of degrees from the set point. I have seen differential controllers on an electrocoat tank with plus or minus 2 degrees. If the set point was 90° the controller turned on at 92° and shut off at 88°, a four-degree swing. The amount of film build applied on a part is dependent on temperature. If the bath is swinging four degrees, the film builds are varying a lot. A differential controller can be fine-tuned, but even with fine-tuning the variability is too large. A differential controller should be replaced with a proportional controller.
A proportional controller varies the amount of cool water, sent to the heat exchanger, according to the temperature. The higher the temperature the larger volume of cool water is sent to the heat exchanger. A proportional controller has an adjustable range. The amount of cool water sent can be adjusted per degree of temperature; 1° over set point, the cool water valve is open 35%. But if the temperature is 2° over, the valve is opened 80%. Fortunately, most of the controllers on an electrocoat tank are proportional. But unfortunately, portions of them are not set up correctly.
To set up a proportional controller you have to go beyond the charting described in this article. The temperature and the valve position need to be recorded every minute for a shift and reviewed. It will be fairly evident, when this data is plotted what adjustments would have to be made. Compare temperature rise versus percent valve open, most of the time the valve is not responding quickly enough for the temperature increase. After changes are made, record data for another shift, review and adjust as necessary. It might take several tries to get the system working properly.
Once the controller is performing satisfactory, you need to determine if the temperature in the tank corresponds to the temperature readout. Take temperature readings at different locations in the tank and compare them to the temperature readout. The circulation can affect the temperature in an electrocoat tank. If the temperature at select locations in the tank is different then the readout, review the circulation in the areas that are in question.
The temperature control in an electrocoat tank can also be affected by the size of the heat exchanger, the temperature of the cooling water and flow through the heat exchangers.
Main Bath pH:
Once the Main Bath % Solids is in control the pH will stabilize, if the anolyte system is performing correctly. There will have to be some fine-tuning to reduce the variability even further. Historically adding acid to the bath controlled the pH. But for some of the newer generations of paint, this is not true. Need to consult your paint supplier on the options to control the pH. If your paint does not require acid additions to control pH, but there is a large variability in the pH, you need to do something. The paint theoretically might not need pH control, but the process is telling you it does. If you have a paint that requires acid additions, batch-feeding acid is the best way to reduce variability. The amount of acid required is related to the amount of feed. Calculate the amount of acid added versus the amount of paint fed into the tank. This calculation should be done after the solids are in control. The calculation should cover at least a month’s worth of data. Determine how much acid to add per paint feed. If you are using 85% acid, you should dilute the acid to about 25%. This increases the volume to be added which will increase the consistency of the adds. It is easier to measure a large amount consistently than a small one, because there is more room for error. In addition the weaker acid will have a lesser effect on the bath if a problem happens and all the acid were pumped into the bath. Set up the acid to be added with the feed.
The measurement method of the pH can affect the variability. Temperature affects pH, if the pH is not measured at the same temperature each time it will appear to vary. This might be picked up in the Gage R and R study, but usually is not. The pH should be measured at a set temperature, usually 77°F or 25°C. The electrocoat baths are operated usually at a higher temperature and have to be cooled to measure pH. Using a constant temperature bath can reduce the variability of the measurement. The constant temperature bath is a device that keeps water at a set temperature. The sample is placed in the constant temperature bath and cools or heats up to the set temperature.
Main Bath Conductivity:
Like the Main Bath pH the conductivity will stabilize when the Main Bath % Solids is in control. If the conductivity does not stabilize, you need to check the amount of dragin coming into the tank. Take a pan and place it at the entrance to the electrocoat tank, under the parts. The pan will collect the drippings off the parts. Measure the conductivity of the drippings; it should be less than 25 µS/cm. If the drippings are higher than needed, you need to rinse the parts better in the last stage of phosphate. If the conductivity of the drippings is less than 25, you need to look at the amount of purge. The bath can be purged two ways, parts carrying liquid out of the system and manually releasing liquid out of the system. Some people purge to control the tank level, which can affect the conductivity. You need to determine the amount of purging that is occurring and why. Stabilize the purge and the conductivity should also stabilize. After the conductivity is stabilized you can fine-tune it by purging according to the conductivity reading. Set up a purge schedule, if the conductivity is x over the set point purge 100 gal or if it is 2x over purge 400 gal and so on.
Conductivity, like pH, is temperature sensitive. The constant temperature bath will help reduce the variability of the conductivity readings.
Main Bath p/b:
Batch feeding the electrocoat tank should stabilize the p/b. You need to make sure the proper ratio of pigment (paste) to resin is being fed. Check the volumes of resin and pigment used each day to confirm the right ratio is being fed. If the p/b does not stabilize, the pigment could be settling. This will be evident when the tank is dumped. If there is settling on the tank bottom, you need to improve the circulation.
DI or RO Water Conductivity:
Water quality needs to be stable for efficient electrocoat tank operation. Water quality can affect many parameters in the tank, cause anode wear, and defects on the parts. If the water quality is not stable contact the supplier of the system and determine what is wrong and fix it.
Anolyte Conductivity:
Anolyte conductivity is like bath temperature—nobody pays attention to it because it is automatically controlled. Anolyte conductivity does vary and can vary significantly. The first thing to check on the anolyte system is the controller. Does the controller turn the water valve on and off properly? Where is the probe for the controller in relationship to the water inlet? If the probe is close to the water inlet, incoming water will dilute the liquid around the probe creating a bad reading. The water inlet should be as close to the bottom of the tank. If the water inlet is near the top, water runs into the tank and out the drain, never diluting the liquid in the tank.
UF Flux Rate:
UF flux rate is charted on a trend chart. This chart is for maintenance purposes. The UF should be cleaned when the flux rate dips to 75% of its original rate. One interesting thing to watch is if the UF flux rate changes as the bath comes into control. The UF performance will usually improve as the bath comes into control. The flux rate might not increase, but the time between cleanings can. In addition, the cartridges can last longer.
Rinse % Solids and Solids to Drain:
These charts are also mainly for maintenance purposes. They are a good indicator of how well the system is performing. These charts will change as the system comes into control. But if they change after the system is in control something has changed and needs to be checked out.
Solids to drain are the amount of paint that is put down the drain. You need to watch this chart closely; it is your money being washed down the drain.
Film Builds:
You need to chart as many parts as possible. Watch the charts as the bath changes; they usually become more stable. After the system is in control, you can fine-tune the facility to improve the film builds.
These parameters are not the only ones that can be charted; other parameters can have an effect on consistency. The ones discussed in this article have the biggest effect on consistency and need to be done first. The ideas discussed for the different parameters are not the only ones that can reduce variability. There are many ways to reduce variability; the only limit is imagination. The ideas discussed are ones that have worked in the past.
Conclusion
Electrocoaters must improve efficiency to remain competitive, with other electrocoaters and other types of coatings. SPC is a proven way to improve efficiency, when applied correctly. This article discussed the beginning applications of SPC to electrocoat systems. Start with these ideas and then improve upon them and then add other parameters. Improve upon these additional parameters. SPC is continuous or never ending quest for improvement.
Lastly, SPC is only as good as the data collected. The instrumentation and methods used to gather the data must be reliable and repeatable. The gage R and R must be done, do not assume it is OK.
RELATED CONTENT
-
Wireless Carrier Fleet Provides Modular Overhead Conveyance
Wireless, modular conveyor system provides flexibility and scalability for carrying parts through finishing processes.
-
Measuring the Surface Area of Fasteners
How do you measure the surface area of a threaded fastener? How much coating would you put on it? How thick of a coating? What about non-threaded fasteners? The U.S. Department of Agriculture’s Forest Service, of all people, may have come up with the solution for those pondering how to coat sometimes-difficult small pieces using computer imaging and software to compute the area.
-
Troubleshooting for Electrocoating
Characterizing the type of defect is essential in identifying the root cause and eliminating its source...


