Electrodeposition of Ni-Fe-Mo-W Alloys - 14th Quarterly Report
14th Quarterly Report - AESF Research Project #R-117. This NASF-AESF Foundation research project report covers the 14th quarter of project work (April-June 2016).
#nasf
by
Yujia Zhang and Prof. E.J. Podlaha-Murphy*
Featured Content
Northeastern University
Boston, Massachusetts, USA
Editor’s Note: This NASF-AESF Foundation research project report covers the 14th quarter of project work (April-June 2016). Progress on the previous quarters has been published in summary in the NASF Report in Products Finishing and in full at www.pfonline.com.** A printable PDF version of the current report is available by clicking HERE.
Beginning in January 2013, the NASF, through the AESF Foundation Research Board, funded a three-year project on alloy plating at Northeastern University, in Boston, under the direction of Dr. Elizabeth Podlaha-Murphy, with emphasis on nickel-molybdenum-tungsten deposits. In 2016, a one-year extension was granted to examine the influence of oxide particulates codeposited with different combinations of Ni, Mo and tungsten alloys on the resulting deposit composition in the generation of novel alloy composites. What follows is the second report on this new work.
Introduction
In our previous report, the effect of titania microparticles on Ni-W electrodeposition from an ammonia-free electrolyte was examined. In the presence of 12.5 g/L particles in the electrolyte, only 4-6 wt% titania particles were captured into the Ni-W alloy, and the alloy deposit composition ratio was not significantly disturbed at low cathodic current densities (<40 mA/cm2), although there was a slight decrease in the amount of tungsten at higher cathodic current densities. In addition, adding particles did not significantly change the current efficiency. However, there was a large change in the surface morphology, with the deposit surface becoming significantly rougher when the particles were present in the electrolyte. In this report, the addition of different amounts of titania microparticles was investigated to examine the effect of particle concentration on deposit composition, partial current density, side reaction, current efficiency and the deposit appearance. In our prior report the temperature was not maintained and was at room temperature. To reduce fluctuations in composition and current efficiency, on account of fluctuations in temperature, in this work, we modified the cell holder to include a double-jacketed cell so that a precise temperature of 25°C was maintained.
Composite electrodeposition refers to the strategy of reducing metal ions and at the same time capturing solid particles from the electrolyte to achieve a two-phase coating, imparting tailored properties to the materials. There are many reports on properties of different particle types electroplated with metals.1-3 Guglielmi4 first reported a two-step adsorption mechanism for the incorporation of particles, which was employed in many studies to predict the amount of particles in the deposit. In the first step, particles are loosely adsorbed onto the electrode in a manner similar to Langmuir adsorption. Therefore, the deposit particle content should increase with an increasing amount of particles in the electrolyte, and reach a maximum level at a large particle electrolyte concentration. In the second step, particles strongly incorporate into the metal film assisted by the electric field, consequently are influenced by the electrochemical process. As a result, the incorporation rate of particle may follow a Tafel-like behavior. While there are other more comprehensive models, the Guglielmi model is a conveniently simple way to quantitatively summarize the amount of particles incorporated into the deposit with plating parameters, under a fixed hydrodynamic environment.
Previous studies on electrodeposited Ni-W alloys with titania particles have been reported in the literature5-7 using a fixed amount of particles in electrolytes with a focus on deposit properties and structure, and with the particle loadings studied being relatively low (below 20 g/L). These studies did not examine the influence of changing the particle concentration in the electrolyte. However, the effect of particle concentration has been reported for other types of particles with Ni-W plating. In ammonium containing electrolytes, Yari and Dehghanian8 reported that the incorporated alumina particle content in the Ni-W deposits first increased with an increasing amount of particles in the electrolyte, and then became almost constant with additional particle electrolyte loading. When there were more tungstate ions than nickel ions in the electrolyte, the maximum amount of particles in the deposit occurred with 5 g/L of particles in the electrolyte. A clear maximum amount of particles in the deposit with the amount of particles in the solution was not observed when there was an excess amount of nickel ions. In our study here there is a small excess of nickel ions compared to tungstate ions. Additionally, the amount of tungsten in the deposits obtained by Yari and Dehghanian was independent of the electrolyte particle concentration. Yao, et al.9 reported on the amount of SiC in electroplated Ni-W-SiC coatings and showed that there was an increase with increasing SiC loading in the electrolytes, without reaching a maximum value.
Our goal for this report is to determine how the particle concentration (over a relatively wide range) affects the alloy composition, amount of particles in the deposit, rate of deposition, side reaction, current efficiency and the deposit appearance, using an ammonia-free electrolyte in order to obtain deposits with high amounts of tungsten.
Experimental
An ammonia-free electrolyte containing 0.15M nickel sulfate, 0.1M sodium tungstate, 0.285M sodium citrate, 1.0M boric acid and variable amounts of titanium dioxide particles was used to plate the composite coating. The electrolyte pH was adjusted to a value of 8 with sodium hydroxide. In order to investigate the effect of particle concentration on Ni-W deposition, 0, 2.5, 7.5, 12.5, 25 and 50 g/L titanium dioxide microparticles (-325 mesh, Acros Organics) were respectively loaded in the electrolytes. A double-jacketed cell using a water bath was employed to maintain the electrolyte temperature at 25°C.
Polarization curves and deposition were carried out on copper covered brass cylinder electrodes, having a diameter of 0.6 cm. A rotating cylinder electrode was employed to measure the polarization curves. The polarization measurements were performed by increasing the applied potential from the open circuit potential value to a large enough potential to achieve a current density that was examined in a rotating Hull cell configuration. The scan rate was 2 mV/sec and the electrode rotation rate was 500 rpm. During the polarization scans, a three-electrode cell configuration was used with a platinum mesh anode and a saturated calomel reference electrode (SCE). The curves were corrected for ohmic drop with impedance spectroscopy (not shown). A rotating Hull cell was used to quickly survey the applied current density conditions. The rotating Hull cell used rods of the same diameter, with a length of 8 cm. A plastic cylinder placed between the anode and the cathode was used to create the current distribution. The average applied current density was 50 mA/cm2, and the rotation rate was 500 rpm.
A Solartron 1287A potentiostat/galvanostat current generator was used for both linear sweep voltammetry and deposition. The composition and thickness were measured using Kevex x-ray fluorescence (XRF).
Results
Polarization curve
Figure 1 shows the polarization curves of Ni-W with different concentrations of titania particles in the electrolytes. With the addition of different amounts of particle electrolyte loading, all polarization curves were shifted to more positive potentials at the low current density region (see inset, Fig. 1). However, no trend in the shift of the polarization curve by varying the particle electrolyte concentration was observed at higher current densities, perhaps due, in part, to the stochastic response generated by the large water reduction, hydrogen evolution side reaction.
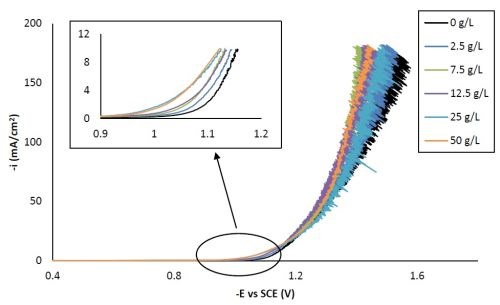
Figure 1 - Polarization curves of the Ni-W-TiO2 citrate-boric acid electrolyte at 500 rpm, 25°C, with 0, 2.5, 7.5, 12.5, 25 and 50 g/L titania microparticles.
Composition
With the rotating Hull cell, the deposit composition measured along the working electrode was correlated with an estimated current density that was converted from a position along the cathode, as mentioned in the previous report. An empirical equation to map the local position, x, to an estimated local current density along the rotating Hull cell length, h, for the specific size and cell design used in this work, is provided by Madore and Landolt:10
(1)
In order to ensure the validity of Equation (1), which assumes a primary current distribution in the absence of transport limitations, the Wagner number, Wa, should be much smaller than one.
It is defined as follows:
(2)
The value of ∂E/∂i is determined from the inverse slope of the polarization curves (Fig. 1) at the average applied cathodic current density, 50 mA/cm2, and has a value of 0.45 A/cm2. The electrolyte conductivity, κ, was assumed to be that of water (0.01 /Ω•cm). The Wagner number was determined to be 0.003 (<< 1), indicating a primary current distribution, and establishing that Equation (1) was a good indicator of the local applied current density on the rotating Hull cell.
Figure 2 shows the variation in alloy composition with different amounts of particle loading in the electrolytes for the estimated local current density obtained along the cathode of the rotating Hull cell. For a particle-free electrolyte, the amount of tungsten, Fig. 2(a), (a) increased from 51 wt% to 64 wt% with an increase in cathodic current densities up to 60 mA/cm2, (b) remained constant at cathodic current densities between 60 mA/cm2 and 100 mA/cm2 and (c) then started to decrease at higher current densities. In the case where titania particles were present in the electrolyte, the weight percentage of tungsten decreased at current densities above 40 mA/cm2, and the tungsten content decreased with increasing particle concentration. However, there was no further change of tungsten content for the electrolytes with particle concentration exceeding 12.5 g/L. Fig. 2(b) shows that the amount of titania in the deposit increased with higher particle electrolyte loading, but reached the maximum amount of ~ 6% when the particle loading was 12.5 g/L or higher. For each particular particle concentration of 2.5 g/L, 7.5 g/L and 12.5 g/L, the particle content was constant over a large range of current densities, and decreased at the very high end of current densities above 100 mA/cm2. For particle concentrations of 25 g/L and 50 g/L, the particle content was constant over the entire range of current densities studied.
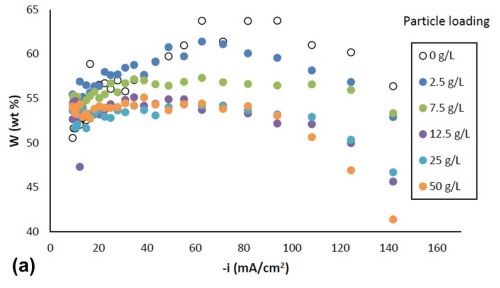
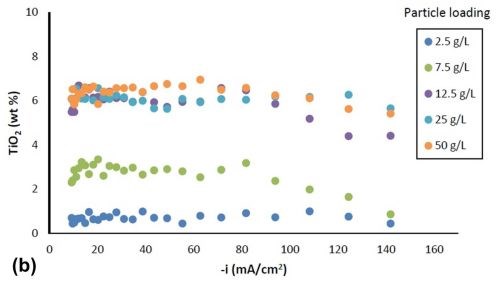
Figure 2 - Ni-W-TiO2 deposit composition with variable particle loading: (a) wt% tungsten and (b) wt% TiO2.
The Guglielmi model4 predicts the volume fraction of particles incorporated into the deposit, 𝛼, by combining features of Langmuir-like adsorption with a component potential dependent component, given in Equation (3):
(3)
with n being the valence, F being Faraday’s constant, ρ being the density of metals, νo being a constant for particle incorporation that is analogous to the exchange current density io, M being the molecular weight of the deposited metals, A, a constant for the metal reduction rate, B, a constant for the particle incorporation rate and η being the overpotential. The data from Fig. 2(b) is replotted in Fig. 3 at one applied cathodic current density, 28 mA/cm2, (-1.2 VSCE at steady state) with the y-axis representing α/(1 - α) as a function of C, the electrolyte particle concentration. The volume fraction was converted from the XRF measurement assuming bulk densities of the deposited metals. Figure 3 shows that α/(1 - α) increases with respect to the electrolyte particle concentration up to 12.5 g/L, and then remains almost constant, similar to a Langmuir adsorption isotherm, as more particles are added to the electrolyte. A similar result was observed by Yari and Dehghanian8 in their study on Ni-W-Al2O3 composite coatings when the electrolyte contained more tungsten than nickel ions.
For a given η, the value of can be assumed to be constant, and Equation 3 can be simplified to
(4)
Using a non-linear fitting routine in Microsoft Excel, (GRG, Generalized Reduced Gradient), the constants 1/k and β were determined to be 3.25 g/L and 0.23 (unitless), respectively. The dashed line in Fig. 3 shows the result using the fitted values of 1/k and β.
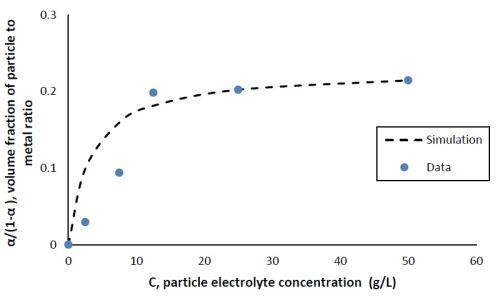
Figure 3 - Volume fraction ratio, α/(1 - α), as a function of the particle electrolyte concentration comparing data with Gugliemi’s model with fitted constants, cathodic current density = 28 mA/cm2 (-1.2 VSCE).
Partial current density
Figure 4 shows the effect of particle concentration on the partial current density (in a logarithmic scale) of nickel and tungsten. The polarization curves allow for a correlation between the estimated current density and the working electrode potential. Using the thickness measurement provided by the XRF and Faraday’s law, the partial current densities can be determined. In the region where the weight percentage of tungsten fell in the deposit (-1.3 VSCE or more negative potentials), there was an enhancement of the nickel partial current density compared to the particle-free electrolyte, but also an inhibition of the tungsten partial current density. Thus, both effects led to less tungsten in the final deposit. However, the change in the partial current density of either nickel or tungsten was not significant, regardless of the particle concentrations studied. At high applied current densities or large negative potentials, the metal partial current densities start to change slope and are perhaps indicative of a mass transport influenced region.
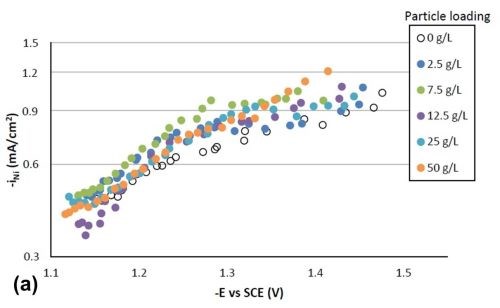
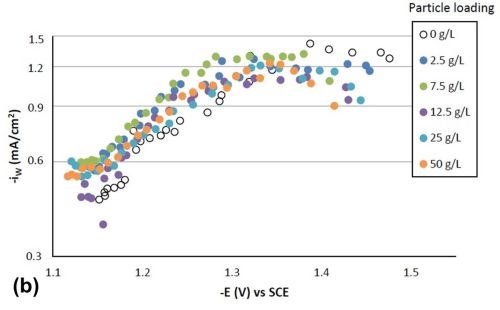
Figure 4 - Partial current densities with variable particle loading: (a) nickel and (b) tungsten.
Tafel slopes were determined for each experimental condition in the kinetically-controlled region (between -1.1 and -1.3 VSCE). They are unusually large, indicating that the adsorption of hydrogen from the side reaction may be blocking the surface, or negatively influencing the metal reduction rates. Adding particles in the electrolyte compared to a particle-free solution tended to slightly decrease the Tafel slope of nickel reduction, and slightly increase that of tungsten reduction. For example, the Tafel slopes for nickel and tungsten are 690 and 380 mV/decade, respectively, but with 25 g/L of particles present in the electrolyte their values changed to 580 mV/decade for nickel and 540 mV/decade for tungsten. The changes in deposit composition in Fig. 2 thus reflect these changes, but at higher applied current densities, and larger negative potentials, the tungsten partial current density changes slope, that may be indicated of a mass transport region. In this region, the particle lowers the tungsten partial current density and lowers the amount of tungsten in the deposit.
Side reaction and current efficiency
Figure 5 shows the effect of particle concentration on the side reaction. There was an enhancement of side reaction for all particle loadings at potentials more negative than -1.3 VSCE, indicating the Ni-W-TiO2 composite coating could be a better catalyst for hydrogen evolution compared to Ni-W alone. The downside to depositing a material that is a good catalyst for the hydrogen evolution reaction is that it can have a poor current efficiency during electrodeposition.
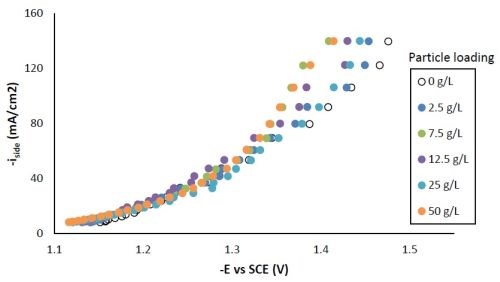
Figure 5 - Side reaction with variable particle loading.
Figure 6 shows that the current efficiency was relatively low for this particular system, as expected for high tungsten weight percentage Ni-W deposition. The current efficiency was highest at the lower current density region or more positive potentials.
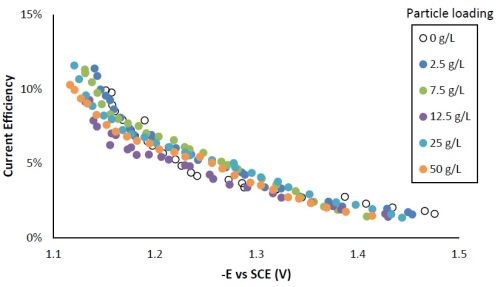
Figure 6 - Current efficiency with variable particle loading.
Deposit appearance
Figure 7 shows the appearance of the Ni-W deposit obtained on the rotating Hull cell with varying concentrations of the particles. The low current density region of the cathodes is at the top of the photograph. The deposit appearance tends to becomes duller with increasing particle concentration, particularly at higher current densities. Similar to the change in deposit composition, there was no further change in the deposit appearance with the particle concentration exceeding 12.5 g/L in the electrolytes.
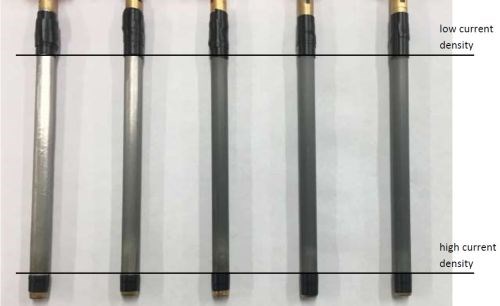
Figure 7 - Photographs of Ni-W deposits with 2.5, 7.5, 12.5, 25 and 50 g/L titania microparticles on the rotating Hull cell.
Conclusions
Composite Ni-W-TiO2 films were electrodeposited from a citrate-boric acid electrolyte. The amount of particles in the deposit followed a Langmuir-like behavior with the amount of particles in the electrolyte, and the results could be captured by a simplification of the classic Guglielmi model. The particles in the electrolyte did not significantly affect the deposit composition at low current densities, but at high current densities, the amount of tungsten in the deposit was lowered with more particles in the deposit.
References
1. F.C. Walsh and C. Ponce de Leon, Transactions of the IMF, 92 (2), 83-98 (2014).
2. C.T.J. Low, et al., Surface and Coatings Technology, 201 (1), 371-383 (2006).
3. M. Musiani, Electrochimica Acta, 45 (20), 3397-3402 (2000).
4. N. Guglielmi, Journal of the Electrochemical Society, 119 (8), 1009-1012 (1972).
5. K.A. Kumar, et al., Ceramics International, 39 (3), 2827-2834 (2013).
6. H. Goldasteh and S. Rastegari, Surface and Coatings Technology, 259C, 393-400 (2014).
7. Y. Zou, et al., Materials Protection, 37, 24-26 (2004).
8. S. Yari and C. Dehghanian, Ceramics International, 39 (7), 7759-7766 (2013).
9. Y.W. Yao, et al., J. Materials Science and Technology, 24, 237-240 (2008).
10. C. Madore and D. Landolt, Plating and Surface Finishing, 80 (11), 73-78 (1993).
Footnotes:
*Corresponding author:
Prof. E.J. Podlaha-Murphy
Professor of Chemical Engineering
Northeastern University
Boston, Massachusetts 02115
Phone: (617) 373-3796
E-mail: e.podlaha-murphy@neu.edu
**Quarter 1 (January-March 2013): Summary: NASF Report in Products Finishing; NASF Surface Technology White Papers, 78 (1), 11-17 (October 2013); http://short.pfonline.com/NASF13Oct2.
Quarter 2 (April-June 2013): Summary: NASF Report in Products Finishing; NASF Surface Technology White Papers, 78 (2), 18-27 (November 2013); http://short.pfonline.com/NASF13Nov2.
Quarter 3 (July-September 2013): Summary: NASF Report in Products Finishing; NASF Surface Technology White Papers, 78 (4), 11-16 (January 2014); http://short.pfonline.com/NASF14Jan2.
Quarters 4-6 (October 2013 - June 2014): Summary: NASF Report in Products Finishing; NASF Surface Technology White Papers, 79 (2), 1-14 (November 2014); http://short.pfonline.com/NASF14Nov1.
Quarter 7 (July - September 2014): Summary: NASF Report in Products Finishing; NASF Surface Technology White Papers, 79 (7), 1-9 (April 2015); http://short.pfonline.com/NASF15Apr1.
Quarter 8 (October - December 2014): Summary: NASF Report in Products Finishing; NASF Surface Technology White Papers, 79 (10), 1-8 (July 2015); http://short.pfonline.com/NASF15Jul1.
Quarter 10 (April - June 2015): Summary: NASF Report in Products Finishing; NASF Surface Technology White Papers, 80 (7), 1-8 (April 2016); http://short.pfonline.com/NASF16Apr1.
Quarters 11-12 (July - December 2015): Summary: NASF Report in Products Finishing; NASF Surface Technology White Papers, 81 (1), 1-10 (October 2016); http://short.pfonline.com/NASF16Oct1.
Quarter 13 (January - March 2016): Summary: NASF Report in Products Finishing; NASF Surface Technology White Papers, 81 (2), 1-8 (November 2016); http://short.pfonline.com/NASF16Nov1.
About the authors:


RELATED CONTENT
-
Federal Courts Stay Implementation of OSHA COVID-19 Rules
In response to a backlash of litigation, multiple federal courts have blocked implementation of OSHA and other new vaccine mandates for general industry, the healthcare industry and federal contractors.
-
AES Research Project #41: Part 4: Adhesion Failure of Electrodeposited Coatings on Anodized Aluminum Alloys
An SEM study of peel-test adhesion specimens from plated coatings on anodized aluminum shows that failure can be categorized in three different modes: (1) specimens exhibiting poor adhesion strength, which fail at the anodic film/coating interface; (2) specimens with good adhesion strength, which fail by local fracture of the anodic film and (3) specimens with excellent adhesion strength , which fail when the applied load is greater than the strength of the alloy substrate. The effect of anodizing parameters and alloy composition on peel test failure are discussed.
-
Development of a Sustainability Metrics System and a Technical Solution Method for Sustainable Metal Finishing: AESF Research Project #R-121, 6th Quarterly Report
The NASF Research Board has funded a research grant at Wayne State University on sustainability in the surface finishing industry, under the direction of Professor Yinlun Huang. The objective of the work is to create a surface-finishing-specific sustainability metrics system to measure economic, environmental and social sustainability. In this report, a benchmarking study of five plants was undertaken to illustrate how the sustainability assessment works.


