
Electrodeposition of Ni-Fe-Mo-W Alloys - 16th Quarterly Report
16th Quarterly Report - AESF Research Project #R-117. This NASF-AESF Foundation research project report covers the 16th and final quarter of this project work (October-December 2016).
#research #nasf
Share
by
Prof. E.J. Podlaha-Murphy*and Yujia Zhang
Featured Content


Northeastern University
Boston, Massachusetts, USA
Editor’s Note: This NASF-AESF Foundation research project report covers the 16th and final quarter of project work (October-December 2016). Progress on the previous quarters has been published in summary in the NASF Report in Products Finishing and in full at www.pfonline.com. A list of all project reports is available at the end of this paper. A printable PDF version of this report is available by clicking HERE.
Beginning in January 2013, the NASF, through the AESF Foundation Research Board, funded a three-year project on alloy plating at Northeastern University, in Boston, under the direction of Dr. Elizabeth Podlaha-Murphy, with emphasis on nickel-molybdenum-tungsten deposits. In 2016, a one-year extension was granted to examine the influence of oxide particulates codeposited with different combinations of Ni, Mo and tungsten alloys on the resulting deposit composition in the generation of novel alloy composites. What follows is the fourth and final report on this new work, involving Ni-W-TiO2 composite plating with the additive 2-butyne-1,4-diol under direct current, pulse current and pulse reverse modes of deposition.
Introduction
In our previous report, Ni-W-TiO2 composite electrodeposits were fabricated under pulse current (PC) conditions, and compared with deposits electrodeposited under direct current (DC) conditions, to examine the effect of PC on deposit composition and partial current density. With PC deposition, the deposit tungsten content was slightly decreased, with an accompanying slight increase in titania and nickel content. Interestingly, under PC deposition, the partial current densities of nickel and tungsten were both enhanced, with a larger enhancement of nickel than tungsten, consistent with the metal compositional changes. In the DC deposition of Ni-W alloys, the addition of particles into the alloy created a duller and rougher surface finish. At the microscopic level, as observed by SEM, PC deposition did not significantly alter the nodular size of the surface features, although it did have an effect of reducing small pits caused by the co-evolving hydrogen side reaction. Preliminary studies combining the additive 2-butyne-1,4-diol (BD) with PC deposition, however, showed an improvement of the surface aspect.
In this report, the influence of BD was further examined. The addition of BD was studied in Ni-W electrodeposition, without TiO2 particles, in our previous 8th and 9th quarterly reports.1,2 Others have noted a brighter and smoother appearance of Ni-W alloys with BD in an ammonium ion-containing electrolyte,3,4 and we similarly found a shinier deposit in an ammonia-free electrolyte. Wu, et al.3 noted that BD enhanced the water reduction side reaction, and not only did we similarly observe an increase in hydrogen evolution, but found that the metal reduction rates were also reduced, at a similar pH of 8, leading to substantially lower current efficiency. It was thought that the lower metal reduction rates were inhibited not only by a blocking effect of adsorbed BD, but perhaps more substantially by the adsorbed hydrogen that it promotes. Since there is this unwanted trade-off, PC deposition may be able to counteract the inhibition effect of the metal reduction reactions, by allowing for the desorption of hydrogen intermediates during the “off” or relaxation part of the pulse cycle. A pulse reverse deposition, with a small anodic component, is also expected to facilitate the desorption of adsorbed hydrogen intermediates.
In an effort to improve the surface morphology of the Ni-W-TiO2 composites, we report here on the use of BD in our former electrolyte comparing DC, PC and PR deposition. A goal of this study was to see if the addition of TiO2 particles in the electrolyte, and co-deposited with the alloy, changed the beneficial improvements in morphology by BD. The amount of BD in the electrolyte was varied. The composite was plated using a rotating Hull cell, followed by composition and thickness analyses to determine how BD effected deposit composition, partial current density, side reaction and current efficiency.
Similar to tungsten, molybdenum cannot reduce alone in aqueous solution, but requires iron group elements, such as nickel, to induce its deposition.5 In order to examine if our results could be translated to the Ni-Mo system, a preliminary investigation of the effect of titania particles on Ni-Mo induced codeposition behavior is also presented in this report. Sodium tungstate was simply replaced with the same amount of sodium molybdate in the electrolyte, while keeping the other conditions the same as our previous study.
Experimental
A boric acid (1.0M), sodium citrate (0.285M), ammonium-free electrolyte was used for the electrodeposition. The Ni-W electrolyte contained 0.1M nickel sulfate and 0.15M sodium tungstate, and the Ni-Mo electrolyte contained 0.1M nickel sulfate and 0.15M sodium molybdate. The electrolyte pH was 8, adjusted with sodium hydroxide, and the titania particle (particle diameters less than 44 microns, -325 mesh) concentration was 12.5 g/L. To examine the effect of BD concentration on the Ni-W-TiO2 composite deposition, 0, 1 and 5 mM BD were added to the electrolyte. To examine the cooperative effect of BD with PC and PR on Ni-WTiO2 composite deposition, a constant BD concentration of 5 mM was used. A double-jacketed cell using a water bath was employed to maintain the electrolyte temperature at 25°C in all cases.
Electrodeposition was carried out on copper covered brass cylinder electrodes, having a diameter of 0.6 cm and length of 8 cm. A rotating Hull cell was used with an electrode rotation rate of 500 rpm to quickly survey different current densities. A plastic cylinder was placed between the anode and the cathode to create the current distribution. When studying the effect of BD concentration on Ni-W-TiO2 composite deposition, the average applied cathodic current density was 33 mA/cm2 for 30 minutes. When studying the effect of titania particle on Ni-Mo deposition, the average applied cathodic current density was 50 mA/cm2 for 30 minutes.
Polarization curves were measured for both investigations, using a rotating cylinder electrode. The polarization measurements were performed by increasing the applied potential from the open circuit potential to a large enough potential to achieve the current density range that was examined in a rotating Hull cell configuration. The scan rate was 2 mV/sec, and the electrode rotation rate was the same value used in the rotating Hull cell experiments. When studying the cooperative effect of BD with PC and PR on Ni-W-TiO2 composite deposition, the average deposition current density was 33 mA/cm2 for all cases, with the off-time current density being zero for the PC deposition and the reverse current density being +5 mA/cm2 for the PR deposition.
The pulse frequency was 20 Hz and the duty cycle was 0.6. The total applied pulsing time was 200 minutes, and the total on-time, where deposition occurred was 120 min.
A potentiostat/galvanostat current generator (Solartron, model 1287A) was used for both DC electrodeposition and linear sweep voltammetry. The pulse or pulse reverse waveforms were generated with a function generator (AMEL, model AMEL 568) connected to a potentiostat (PINE Instrument Company, model AFCBP1). The deposit composition and thickness were measured using x-ray fluorescence (XRF), (Kevex, model Omicron), in an air environment.
Results
Variable BD concentration
Polarization curves. Figure 1 shows the polarization curves of Ni-W-TiO2 with different concentrations of BD in the electrolyte. With increasing amounts of BD, the polarization curves were shifted to more negative potentials. Srinivasan and Bapu6 also observed a similar trend of inhibiting the total current density with an increasing concentration of BD, in a nickel-based electrolyte.
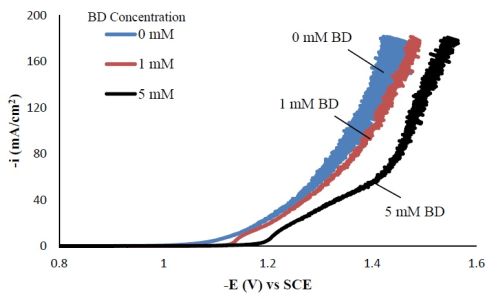
Figure 1 - Polarization curves of the Ni-W-TiO2 citrate-boric acid electrolyte at 500 rpm, 25°C with 0, 1 and 5 mM BD.
Composition. With the rotating Hull cell under DC conditions, a primary current distribution was assumed, as justified in our previous reports by evaluating the Wa number and verifying that it was significantly lower than 1. Figure 2 shows the variation in deposit composition with variable BD concentration in the electrolyte at different estimated local current densities along the cathode of the rotating Hull cell. For a BD-free electrolyte, the tungsten composition in the deposit, as shown in Fig. 2(a), is relatively constant at 55 wt% between 20 and 100 mA/cm2. Adding 1 mM BD slightly decreased the deposit tungsten content at low cathodic current densities up to ~40 mA/cm2, but it had no significant effect at higher current densities. A larger BD concentration of 5 mM had a dramatic change in the deposit composition at the mid to high current density ranges. In this region, the tungsten deposit concentration dropped to ~ 30 wt%. Figure 2(b) shows that with no BD added, the amount of titania in the deposit was almost constant (~5 wt%) over the entire range of current densities studied. With a low concentration of BD (1 mM), the amount of titania in the deposit slightly increased at low cathodic current densities below 60 mA/cm2, but remained unchanged at higher current densities compared to the case when there was no BD in the electrolyte. With the high concentration of BD (5mM), the deposit titania content exhibited unusual behavior. It was lower compared to the case where no BD was present at cathodic current densities lower than 60 mA/cm2, but the titania content increased at higher current densities.
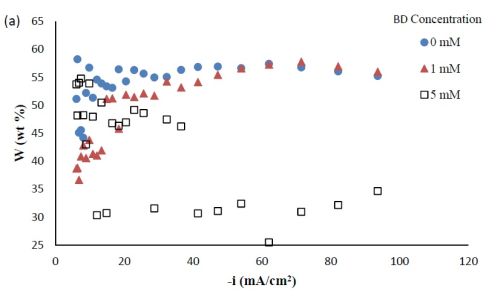

Figure 2 - Ni-W-TiO2 deposit composition with variable BD concentration: (a) wt% tungsten and (b) wt% TiO2.
Partial current densities. Figure 3 shows the effect of BD concentration on the partial current density of nickel and tungsten. The polarization curves (Fig. 1) allow for a correlation between the estimated, local current density and the working electrode potential. Using the thickness measurement provided by the XRF and Faraday’s law, the partial current densities can be determined. As expected from previous studies without TiO2, a high concentration of BD in the electrolyte inhibits the reduction rate of nickel (Fig. 3(a)) and tungsten (Fig. 3(b)). In the region where the tungsten content decreased, the reduction rate of tungsten was inhibited more than that of nickel, which is reflected in less tungsten in the deposit.


Figure 3 - Partial current densities of Ni-W-TiO2 composite deposition with variable BD concentration: (a) nickel and (b) tungsten.
Side reaction and current efficiency. Figure 4(a) shows the effect of BD concentration on the side reaction. The side reaction was unexpectedly inhibited with increasing concentration of BD in the electrolyte. In contrast, the current efficiency was lowered with increasing concentration of BD (Fig. 4(b)) as a result of the lower metal reduction rates. Therefore, the shift observed in the polarization curves (Fig. 1) to more negative potentials was due to the inhibition of both metal reduction and side reaction with the addition of BD.


Figure 4 - Side reaction (a) and current efficiency (b) of Ni-W-TiO2 composite deposition with variable BD concentration.
Deposit appearance. Figure 5 shows the appearance of the Ni-W-TiO2 deposit obtained on the rotating Hull cell with varying concentrations of the BD in the electrolyte. The low current density region of the cathodes is at the top of the photograph. The deposit appearance is perhaps slightly brighter and smoother with increasing BD concentration near the high current density region, although not to the degree desired and still fairly rough, thus motivating our study to see if applying a pulse waveform would improve the morphology.

Figure 5 - Photographs of Ni-W-TiO2 composite coatings plated with (a) 0 mM, (b) 1 mM and (c) 5 mM BD in the electrolyte for 30 min.
BD with PC and PR composite deposition
Composition. When investigating PC and PR deposition onto a rotating Hull cell, the current distribution is not at steady state and an estimate of the local current density is not straight forward. Thus, the composition is presented as measured along the dimensionless length of the electrode, L = x/h, with x being the distance from the low current density end of the working electrode and h being the total length of the working electrode. Figure 6 compares the deposit composition of a DC plated deposit with PC and PR plated deposits. The rotating Hull cell design is expected to provide a current distribution along the working electrode. The amount of BD was 5mM BD in the electrolyte, and the frequency was 20 Hz with a duty cycle of 0.6 for PC and PR deposition. Figure 6(a) shows that PC and PR had similar effects, increasing the amount of tungsten in the deposit, particularly in the high current density region. Figure 6(b) shows that PC and PR had a modest effect on the particle composition.


Figure 6 - Ni-W-TiO2 deposit composition of (a) wt% tungsten and (b) wt% TiO2 under DC, PC and PR conditions, in the presence of 5mM BD, with respect to a dimensionless length L, representing lower and higher current densities with smaller and larger values, respectively.
Deposit thickness and partial current density. Since the local current density is less definitive, due to the changing current distribution during pulsing, the calculation of the current efficiency is not as straightforward compared to the DC case (Fig. 4(b)) from the rotating Hull cell. However, changes in the deposit thickness, and thus, the metal partial current densities, reflect changes in the current efficiency. Figure 7 shows the deposit thicknesses of the DC, PC and PR fabricated films along the electrode in the presence of 5mM BD, with the same deposition on-time and the calculated partial current densities of nickel and tungsten. In Fig. 7(a), particularly near the high cathodic current density region, the deposits generated by PC and PR are thicker and therefore, have a higher current efficiency. Figure 7(b) shows that PC and PR enhanced the reduction of both nickel and tungsten at high current densities, and the enhancement was more significant with PC deposition. Assuming an adsorption mechanism, during the deposition, the adsorbed intermediate metal ion species, Niads and Wads were formed on the cathode surface, as well as adsorbed hydrogen Hads. If the off-time (for PC) and reverse-time (for PR) facilitated the desorption of Hads from the cathode surface, more surface area was available for the metal reduction, and thus the partial current densities increased. The differences in composition with PC and PR can be viewed from the point of view of changing metal intermediate species. In PR deposition, in addition to facilitating the desorption of hydrogen, Hads, the reverse current density may have also lead to less Niads and Wads on the cathode surface, or oxidation of the metal back to its ions, which in turn decreased the metal reduction rate. Therefore, PC had more significant effect on improving the partial current density than PR.


Figure 7 - Deposit thickness (a) and partial current density (b) of nickel and tungsten under DC, PC and PR conditions, in the presence of 5mM BD, with respect to a dimensionless length L representing lower and higher current densities with smaller and larger values, respectively.
Deposit appearance. A photograph of the electrodes are presented in Fig. 8 which shows the appearance of the Ni-W-TiO2 composite deposits obtained under PC and PR (from left to right) modes. The low current density region of the cathodes is at the top of the photograph. Near the mid to high current density region, where L is between 0.5 and 0.8, the deposits plated with PC and PR deposition contained equal or slightly higher titania content and were significantly brighter than the DC plated deposits (Fig. 5(c)). In our past report,7 it was noted that the morphology of the deposit became rougher as the particle incorporation increased. Thus, the PC and PR deposition, together with BD, was able to not only improve the morphology but also retain, and not decrease the amount of particles in the deposit.

Figure 8 - Photographs of Ni-W-TiO2 composite coatings plated with (a) PC and (b) PR, 5mM BD for a total time of 200 min (on-time: 120 min).
Comparing DC Ni-W-TiO2 with Ni-Mo-TiO2 composite deposition
Polarization curves. Figure 9 shows that the polarization profile of the molybdenum-containing electrolyte, replacing the sodium tungstate with sodium molybdate. It was not altered by adding the particles in the electrolyte. Comparing the polarization behavior with Fig. 1 for the Ni-W-TiO2 electrolyte, the Ni-Mo-TiO2 electrolyte polarization curve rises with smaller overpotentials, indicative of a larger side reaction.

Figure 9 - Polarization curves of Ni-Mo deposition with and without TiO2 particles.
Figure 10 compares the appearance of Ni-Mo deposits with and without 12.5 g/L titania particles in the electrolyte, under DC deposition. The low current density region of the cathodes is at the top of the photograph and in this region no deposit was formed, although gas bubbles were evident and thus the hydrogen evolution side reaction occurred. Deposition took place at the high current density end, regardless of whether the particle was present or not in the electrolyte, unlike the Ni-W-TiO2 electrodeposition.

Figure 10 - Photographs of Ni-Mo coatings (a) without and (b) with the addition of 12.5 g/L titania particle loading in the electrolyte with 5mM BD.
Composition and thickness analyses were performed for the part of the working electrode where the deposit thickness was larger than 0.1 μm, as outlined in Fig. 10. The deposit composition at different local current densities along the electrode is shown in Fig. 11. A primary current distribution was assumed as the experiments were conducted under a single, average applied current density. Figure 11(a) shows that the weight percentage of molybdenum was almost the same for both deposits with and without added TiO2 in the electrolyte. The titania content was only ~1 wt% in the deposit, (Fig. 11(b)). Moreover, the reduction rate, or partial current densities of both nickel and molybdenum remained almost unchanged in the presence of the particle, as shown in Figs. 11(c) and (d). The potential scale was determined by using the estimated local current density and determining the corresponding potential from the polarization curve in Fig. 9. In this case, the potential range is narrow on account of the large side reaction, limiting the potential window of deposition. Recalling our previous study on Ni-W deposition with the same titania particle loading, the titania content was ~6 wt% over the entire working electrode. The observed results indicate that the titania incorporation rate acts differently for the electrodeposition of Ni-Mo alloys as compared to Ni-W alloys.


Figure 11 - Ni-Mo and Ni-Mo-TiO2 deposit composition: (a) wt% Mo, (b) wt% TiO2 and the partial current densities of (c) Mo and (d) Ni.
Conclusions
While the use of the 2-butyne-1,4-diol (BD) additive is best known to improve the morphology of nickel and Ni-W alloys, it however, did not always do so for the electrodeposited Ni-W-TiO2 composites. However, combining BD together with a pulsing scheme was the “magic bullet.” To summarize, the following observations characterized the influence of BD during DC, PC and PR deposition on Ni-W-TiO2 composites; a comparison between Ni-Mo versus Ni-W alloys deposited in the presence of TiO2 particles in the electrolyte also show that these two alloy systems are less alike than expected.
- Ni-W-TiO2 composite coatings were electrodeposited under DC conditions with different concentrations of additive BD in the electrolyte. The addition of BD decreased the deposit tungsten content, and altered the amount of TiO2 in the deposit. How it changed the TiO2 was dependent on the current density. The metal reduction rate and side reaction rate were both inhibited with increasing BD concentration, and the deposits did not become significantly brighter.
- Ni-W-TiO2 composite coatings were electrodeposited, with DC, PC and PR, with 5mM BD. Both PC and PR increased the amount of tungsten in the deposit, but didn’t significantly change the amount of titania incorporated within a wide range of current density. Under PC and PR conditions, deposits with a brighter surface were obtained, while keeping the titania content similar to that of DC plated deposits.
- Ni-Mo-TiO2 composite coatings were electrodeposited under DC conditions with and without 12.5 g/L TiO2 particle loading in the electrolyte. The addition of the particles did not influence the Ni-Mo composition under the studied experimental conditions, and the amount of particles incorporated into the deposit was significantly lower when compared to the Ni-W composite.
References
- E.J. Podlaha and A. Kola, “Electrodeposition of Ni-Fe-Mo-W Alloys - Part 8,” Products Finishing, 79 (10), (2015); http://short.pfonline.com/NASF15Jul1
- A. Kola and E.J. Podlaha, “Electrodeposition of Ni-Fe-Mo-W Alloys - Part 9,” Products Finishing, 79 (11), (2015); http://short.pfonline.com/NASF15Aug1
- Y. Wu, et al., Surf. Coat. Technol., 173 (2-3), 259-264 (2003).
- M. Zheng and R.D. Hilty, ECS Trans., 25 (41), 117 (2010).
- A. Brenner, Electrodeposition of Alloys, Academic Press, Inc., New York (1963).
- R. Srinivasan and G.N.K. Ramesh Bapu, Trans. Inst. Met. Finish., 91 (1), 52-56 (2013).
- Y. Zhang and E.J. Podlaha, “Electrodeposition of Ni-Fe-Mo-W Alloys - Part 14,” Products Finishing, 80 (3), (2016); http://short.pfonline.com/NASF16Dec1
Past project reports
- Quarter 1 (January-March 2013): Summary: NASF Report in Products Finishing; NASF Surface Technology White Papers, 78 (1), 11-17 (October 2013); http://short.pfonline.com/NASF13Oct2.
- Quarter 2 (April-June 2013): Summary: NASF Report in Products Finishing; NASF Surface Technology White Papers, 78 (2), 18-27 (November 2013); http://short.pfonline.com/NASF13Nov2.
- Quarter 3 (July-September 2013): Summary: NASF Report in Products Finishing; NASF Surface Technology White Papers, 78 (4), 11-16 (January 2014); http://short.pfonline.com/NASF14Jan2.
- Quarters 4-6 (October 2013-June 2014): Summary: NASF Report in Products Finishing; NASF Surface Technology White Papers, 79 (2), 1-14 (November 2014); http://short.pfonline.com/NASF14Nov1.
- Quarter 7 (July-September 2014): Summary: NASF Report in Products Finishing; NASF Surface Technology White Papers, 79 (7), 1-9 (April 2015); http://short.pfonline.com/NASF15Apr1.
- Quarter 8 (October-December 2014): Summary: NASF Report in Products Finishing; NASF Surface Technology White Papers, 79 (10), 1-8 (July 2015); http://short.pfonline.com/NASF15Jul1.
- Quarter 9 (January-March 2015): Summary: NASF Report in Products Finishing; NASF Surface Technology White Papers, 79 (11), 1-10 (August 2015); http://short.pfonline.com/NASF15Aug1.
- Quarter 10 (April-June 2015): Summary: NASF Report in Products Finishing; NASF Surface Technology White Papers, 80 (7), 1-8 (April 2016); http://short.pfonline.com/NASF16Apr1.
- Quarters 11-12 (July-December 2015): Summary: NASF Report in Products Finishing; NASF Surface Technology White Papers, 80 (12), 1-10 (September 2016); http://short.pfonline.com/NASF16Sep1.
- Quarter 13 (January-March 2016): Summary: NASF Report in Products Finishing; NASF Surface Technology White Papers, 81 (1), 1-8 (October 2016); http://short.pfonline.com/NASF16Oct1.
- Quarter 14 (April-June 2016): Summary: NASF Report in Products Finishing; NASF Surface Technology White Papers, 81 (3), 1-8 (December 2016); http://short.pfonline.com/NASF16Dec1.
- Quarter 15 (July-September 2016): Summary: NASF Report in Products Finishing; NASF Surface Technology White Papers, 81 (3), 1-8 (December 2016); http://short.pfonline.com/NASF17Feb1.
Footnote:
*Corresponding author:
Prof. E.J. Podlaha-Murphy
Professor of Chemical Engineering
Northeastern University
Boston, Massachusetts 02115
Phone: (617) 373-3796
E-mail: e.podlaha-murphy@neu.edu
About the authors:


RELATED CONTENT
-
White Bronze, Copper-Tin-Zinc Tri-metal: Expanding Applications and New Developments in a Changing Landscape
This paper deals with the renewed interest in applications for white bronze tri-metal (Cu-Sn-Zn alloy).
-
Troubleshooting Chromium Conversion Coatings on Aluminum
This paper provides processors with an extensive troubleshooting tool when conversion coating failures are encountered.
-
Passivation Basics
What is commonly referred to as "passivating" on a shop floor is actually just enhancement of a naturally occurring process on most stainless steels.


