Published
Electrodeposition of Zinc Films from Environmentally-Friendly Gluconate Salt Solutions
The electrodeposition of zinc onto steel has been widely adopted in industry due to high corrosion resistance of the coating system.
by
S.S. Abd El Rehim,*1 E.A. Abd El Meguid2,3 and M.E.A. Abass2
1Department of Chemistry, Faculty of Science, Ain Shams University, Cairo, Egypt
2Department of Electrochemistry and Corrosion, National Research Centre, Dokki, Cairo, Egypt
3Department of Chemistry, Faculty of Science, JazanUniversity, KSA
ABSTRACT
The electrodeposition of zinc onto steel substrates from gluconate baths containing zinc sulfate and sodium gluconate at pH ~ 4.5 has been investigated under different plating and operating conditions. The influences of bath composition and temperature on cathodic polarization, cathodic current efficiency (CCE) and throwing power were studied. It was found that the cathodic current efficiency increased with increasing ZnSO4 concentration and temperature but it decreased with increasing sodium gluconate content. The optimum conditions for producing sound zinc films are: 70 g/L ZnSO4•7H2O, 5.0 g/L sodium gluconate, current density I = 0.5 A/dm2, pH~ 4.5 and a temperature T = 25°C. The CCE of the zinc electrodeposition was ~ 95% due to hydrogen evolution. The anodic linear stripping voltammetry for zinc shows one anodic current peak corresponding to zinc dissolution. The linear relation between current density and t-1/2 assumes that the initial deposition of zinc onto a platinum surface takes place via instantaneous nucleation followed by 3-D growth under charge transfer control. The zinc deposit exhibits a hexagonal crystalline phase which shows (002) preferential orientation. Increasing the concentration of sodium gluconate improves the throwing power of the bath.
Keywords: Zinc, electrodeposition, anodic linear stripping, throwing power, gluconate salt solutions.
Introduction
The electrodeposition of zinc onto steel has been widely adopted in industry due to high corrosion resistance of the coating system. Moreover, zinc metal is more electronegative than iron and can protect it sacrificially. Zinc can be electrodeposited from acidic and alkaline baths.1,2 Among the acidic baths used are sulfate,3-5 chloride6-7 and acetate solutions.8 Unfortunately, these baths are known to have poor throwing power. Zinc sulfate is the most common acidic bath while chloride and fluoborate-based baths are used less frequently.9 On the other hand, zinc can be electrodeposited from alkaline cyanide baths, which are characterized by good throwing power. However, cyanide baths are not recommended because of their toxicity.
Yan, et al.10 electrodeposited zinc from sulfate solution and showed that zinc plated from this solution formed a nano-laminated structure consisting of 50 nm thick crystals. The author proved that, for electrodeposition of zinc under potentiostatic control at -1.00 VSCE on a steel cathode, no deposition of zinc takes place, but zinc oxide/hydroxide precipitates and attaches itself to the steel substrate.
In the present work, we investigated the electrodeposition of zinc onto a steel cathode from baths containing zinc sulfate and sodium gluconate at pH ~ 4.5 under different plating and operating conditions to help us in understanding electrodeposition zinc from gluconate baths.
Experimental
In the current work, all solutions were freshly prepared from Fluka grade chemicals and doubly-distilled water. The numbers and chemical composition of these baths are given in Table 1.
Table 1 - The chemical composition of the zinc electrodeposition baths (pH ~ 4.5) studied.
Bath# | ZnSO4•7H2O, g/L | Sodium gluconate, g/L |
Zn-1 | 30 | 5.0 |
Zn-2 | 50 | 5.0 |
Zn-3 | 70 | 5.0 |
Zn-4 | 90 | 5.0 |
Zn-5 | 50 | 0.0 |
Zn-6 | 50 | 2.0 |
Zn-7 | 50 | 10.0 |
Zn-8 | 20 | 5.0 |
Zn-9 | 60 | 5.0 |
Zn-10 | 50 | 8.0 |
Zn-12 | 50 | 12.0 |
Zn-13 | 25 | 5.0 |
Zn-14 | 75 | 5.0 |
For the electrodeposition measurements, a mild steel sheet cathode and platinum sheet anode, both of dimensions (2.5 × 3.0 cm) were used. The plating cell was a rectangular Perspex trough (10 × 3 × 2.5 cm) provided with vertical grooves on each of the side walls to fix the electrodes. Before each run, the mild steel cathode was subjected to mechanical polishing with various grades of emery paper (600 up to 1200) followed by degreasing with acetone, washed with distilled water, dried and weighed. At the end of deposition (15 min), the cathode was withdrawn, washed with distilled water, dried and weighed. The cathodic current efficiency (CCE) of zinc deposition was calculated as QZn / Qtotal × 100, where QZn is the real charge estimated from the quantity of zinc deposited and Qtotal is the theoretical charge calculated from Faradays Law. The crystal structure of deposited zinc was examined by x-ray diffraction analysis using Philip diffractometer PW 1390 (40 KV, 25 mA) with Ni filter and Co Kα radiation.
The potentiodynamic cathodic polarization curves were measured in the rectangular cell containing mild sheet and platinum sheet as working and counterelectrodes, respectively. A saturated calomel electrode (SCE) was used as a reference electrode. The reference electrode was connected to the working electrode via a bridge provided with a Luggin-Haber tip filled with the solution under test. The tip was placed very close to the electrode surface. Polarization measurements were conducted using an EG&G 273A potentiostat/galvanostat, which was connected to a computer.
The percentage throwing power (TP%) of the solution was measured using the rectangular cell with one platinum anode placed between two parallel steel cathodes where the ratio of the far to the near distance was 5:1. The TP percentage was calculated from Field’s formula,
TP% = ( (L-M) / (L+M-2) ) × 100 (1)
where L is the current distribution ratio or linear ratio (5:1) and M is the metal distribution ratio of the near to the far cathode position. In some cases, the values of M were measured as a function of L over the range of L ratios varying between 1:1 and 5:1. The throwing index (TI) of the tested bath was the reciprocal of the slope of a plot of M vs. L.
Potentiodynamic anodic linear stripping voltammetric responses were recorded in the rectangular cell containing platinum sheet as a working electrode, a saturated calomel reference electrode and platinum sheet as a counterelectrode. Zinc deposition was performed on the platinum electrode at a constant deposition potential for constant time. At the end of each deposition time, a stripping analysis was carried out immediately in the same solution (in situ) by scanning the potential to a more anodic direction at a scan rate of 5.0 mV/sec. All experiments were carried out at constant temperature ±1°C with the help of an air thermostat.
Results and discussion
Potentiodynamic cathodic polarization
The potentiodynamic cathodic polarization curves during zinc electrodeposition from the gluconate baths were recorded under different experimental conditions and are shown in Figs. 1-3. These curves were swept from the rest potential (zero current potential) towards the more negative direction with a scan rate of 5.0 mV/sec. In all cases, the polarization curves are characterized by the appearance of a cathodic peak C followed by rapid rise in current density at a given deposition potential Ed. Similar results have been observed previously for zinc deposition from aqueous baths.11,12 In the presence of gluconate ion, G- (G- is CH2OH(CHOH)4]-), Zn+2 ions may form zinc gluconate and [ZnG]+ complex species.13 Therefore zinc metal is produced by the cathodic reduction of both free Zn+2 and complex ions simultaneously with hydrogen evolution from a side reaction. The appearance of this cathodic peak C is attributable to the hydrogen evolution reaction:
2H2O + 2e- = H2 + 2OH-
It seems that the pH near the cathodic surface increases according to the above reaction.14 The increase in pH allows the precipitation of zinc oxide or hydroxide on the electrode surface within the region of peak C.15 It is probable that sites for hydrogen evolution are blocked by zinc hydroxide which would decrease rate of hydrogen evolution. Therefore, the current beyond the peak current of peak C declines gradually up to certain potential Ed where the current rises sharply as a result of deposition of zinc metal on the steel surface. This potential represents the deposition potential of zinc, Ed.
Several mechanisms have been proposed for the overall cathodic reduction of Zn+2 ions. Some authors16,17 suggest that charge transfer occurs from the bivalent Zn+2 ions, which can be either solvated or complexed in the electrolyte in two successive monoelectronic steps involving monovalent intermediate Zn+.
Zn+2 + e- = Zn+
Zn+ + e- = Zn
On the other hand, other authors18 suggest that a rise in surface pH leads to the formation of monohydroxide species ZnOH+, which may precipitate in the zinc deposition mechanism process:
ZnOH+ + 2e- = Zn + OH-
Figure 1 shows potentiodynamic cathodic polarization curves under the influence of increasing ZnSO4 concentration in baths containing 5.0 g/L sodium gluconate at 25°C. It is obvious that an increase in ZnSO4 content in the bath has no significant influence on the cathodic peak current C, but it does shift the deposition potential of zinc, Ed, towards the less negative direction. The decrease in cathodic polarization could be related to a decrease in concentration polarization as a result of increasing the concentration of Zn+2 in the solution. Therefore high cathodic current efficiency should be expected from a solution containing a high concentration of ZnSO4.
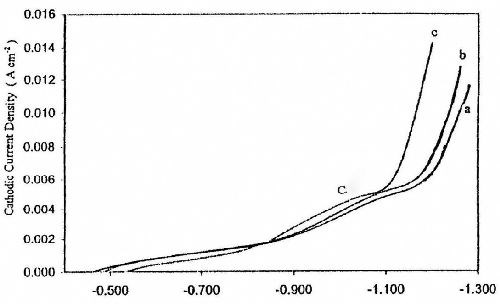
Figure 1 - Effect of ZnSO4 concentration on potentiodynamic cathodic polarization curves for zinc electroplating from baths containing: (a) 8.0 g/L ZnSO4•7H2O and 5.0 g/L sodium gluconate; (b) 50 g/L ZnSO4•7H2O and 5.0 g/L sodium gluconate; (c) 60 g/L ZnSO4•7H2O and 5.0 g/L sodium gluconate at T = 25°C and with scan rate of 5.0 mV/sec.
Figure 2 represents the influence of sodium gluconate concentration on cathodic polarization curves of zinc deposition. It is clear that an increase in gluconate concentration in the bath increases the height of cathodic peak C, but has no significant influence on the deposition potential of zinc, Ed. These changes in the cathodic polarization curves suggest that the presence of gluconate ions favors the evolution of hydrogen gas. Therefore a decrease in the efficiency of zinc deposition is to be expected.
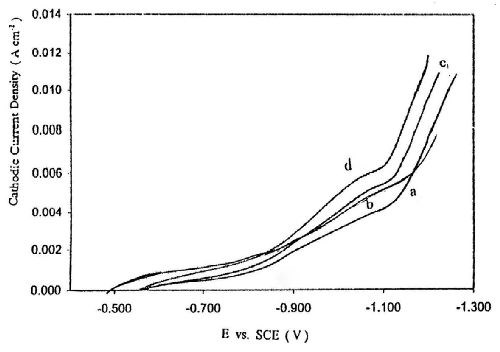
Figure 2 - Effect of sodium gluconate concentration on potentiodynamic cathodic polarization curves for zinc electroplating from baths containing: (a) 50 g/L ZnSO4•7H2O and 2.0 g/L sodium gluconate; (b) 50 g/L ZnSO4•7H2O and 5.0 g/L sodium gluconate; (c) 50 g/L ZnSO4•7H2O and 8.0 g/L sodium gluconate; (d) 50 g/L ZnSO4•7H2O and 12 g/L sodium gluconate, T = 25°C and with a scan rate of 5.0 mV/sec.
Figure 3 shows the effect of temperature on the cathodic polarization curves from Bath #Zn-2. The data reveal that an increase in temperature increases the height of cathodic peak C and shifts the deposition potential of zinc, Ed, to less negative potentials. These changes are related to the depolarization effect of temperature on activation polarization, both for hydrogen evolution and zinc deposition. Moreover, a rise in temperature enhances the concentration of reducible species in the diffusion layer as a result of increasing their rates of diffusion with rising temperature.
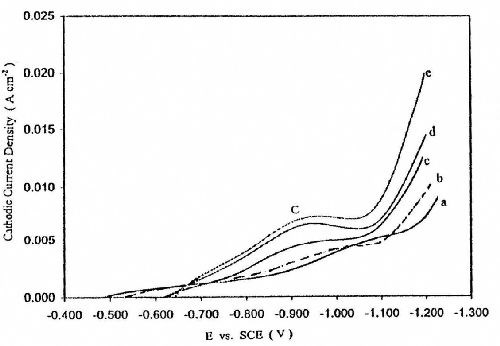
Figure 3 - Effect of temperature on potentiodynamic cathodic polarization curves for zinc electroplating from a bath containing 50 g/L ZnSO4•7H2O and 5.0 g/L sodium gluconate with a scan rate of 5.0 mV/sec: (a) 25°C; (b) 35°C; (c) 40°C; (d) 50°C; (e) 60°C.
Cathodic current efficiency
The effect of bath composition and temperature on the cathodic current efficiency (CCE) of zinc deposition onto a steel substrate was determined galvanostatically in order to obtain the optimum conditions for producing satisfactory zinc deposits.
Figure 4 shows the effect of ZnSO4 concentration on the CCE of the zinc deposition from baths containing 5.0 g/L sodium gluconate at 25°C, I = 0.5 A/dm2 and t = 10 min. The CCE values increase with increasing concentration of ZnSO4 in the bath. The improvement in CCE agrees well with the effect of ZnSO4 concentration on cathodic polarization curves as shown in Fig. 1.
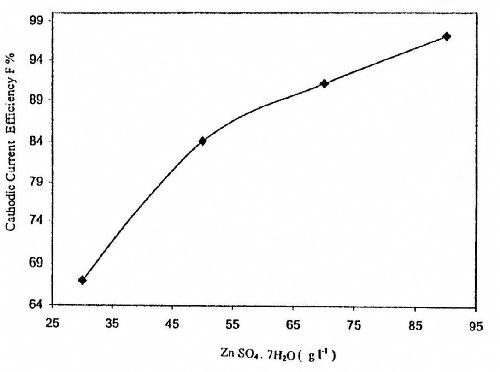
Figure 4 - Effect of ZnSO4 concentration on cathodic current efficiency for zinc electroplating from a bath containing 5.0 g/L sodium gluconate at T = 25°C, I = 0.5 A/dm2 and t = 10 min.
Figure 5 shows the effect of gluconate content in baths containing 50 g/L ZnSO4•7H2O at T = 25°C, I = 0.5 A/dm2 and t = 10 min on the CCE of the zinc deposition. It is clear that the CCE decreases with increasing gluconate content in the bath. This result is expected from the cathodic polarization curves of Fig. 2. The data can be explained on the basis that increasing the concentration of gluconate ion in the solution increases the stability constant of the zinc gluconate complex species. Such a trend causes a decrease in the concentration of free Zn+2 ion and therefore inhibits the deposition of zinc metal.
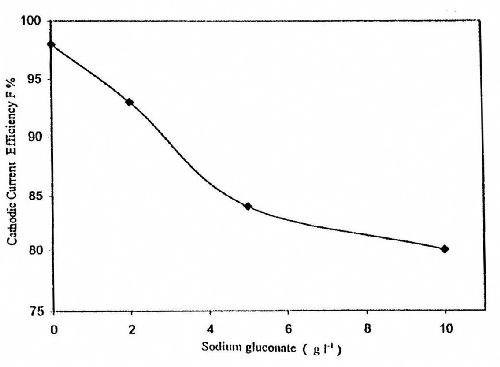
Figure 5 - Effect of sodium gluconate concentration on cathodic current efficiency for zinc electroplating from a bath containing 50 g/L ZnSO4•7H2O at T = 25°C, I = 0.5 A/dm2 and t = 10 min.
Figure 6 shows the influence of bath temperature on the CCE of the zinc deposition from Bath #Zn-2 at I = 0.5 A/dm2 and t = 10 min. The data reveal that the CCE of the zinc deposition increases with increasing temperature, especially above 35°C. It is probable that increasing the temperature has a greater depolarizing effect on zinc deposition than on hydrogen evolution and an increase in the efficiency of zinc deposition with temperature might be expected.
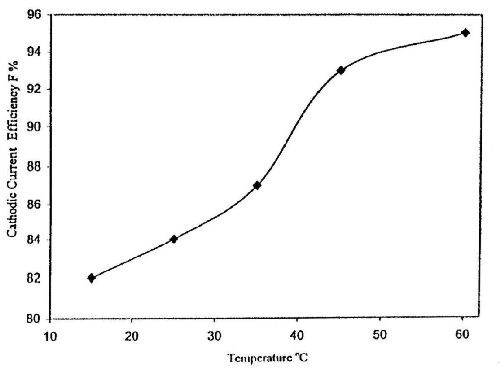
Figure 6 - Effect of bath temperature on the cathodic current efficiency for zinc electroplating from a bath containing 50 g/L ZnSO4•7H2O and 5.0 g/L sodium gluconate, I = 0.5 A/dm2 and t = 10 min.
Anodic linear stripping voltammetry (ALSV)
A series of anodic linear stripping voltammetry responses were recorded for potentiostatically electrodeposited zinc onto a platinum electrode from the gluconate bath for a given time. At the end of the time, the potential of the electrodeposited zinc electrode was swept in the positive direction at a scan rate of 5.0 mV/sec. The anodic stripping responses for zinc were recorded under different experimental conditions. The data reveal that, in all cases, anodic responses exhibit single anodic peak (peak A), corresponding to the anodic dissolution of zinc deposited previously onto the platinum surface. The presence of only one anodic peak suggests that zinc is electrodeposited from the gluconate bath in one phase. No residual zinc or zinc oxide could be detected visually on the platinum electrode surface beyond the anodic peak A. Therefore, the charge consumed through the anodic peak A can be taken as quantitative measure for the quantity of zinc deposited cathodically on the platinum surface.
Figure 7 shows the effect of the cathode potential Es, at which the electrodeposition of zinc occurs, on the quantity of zinc deposited. These experiments were carried out from Bath #Zn-2 at T = 25°C and at fixed cathodic potential step Es (-1.1 to -1.7 V). It is worth noting that no anodic dissolution peak was observed when the cathodic potential was less negative than -1.2 V. This confirms the suggestion that no zinc is electrodeposited within the potential range of the peak C. Only the deposition of zinc and consequently the appearance of the anodic stripping peak starts when the potential is -1.2 V or more negative. The results reveal that the quantity of zinc deposited on the platinum surface increases with moving the potential step Es to more negative values.
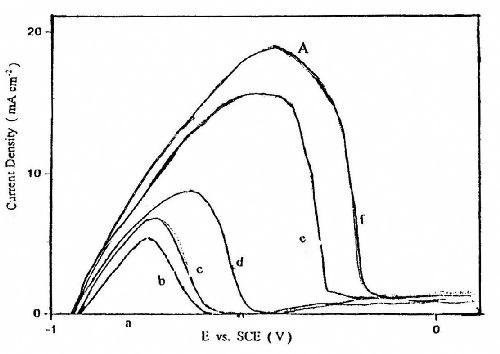
Figure 7 - Anodic linear stripping voltammetric curves for zinc electroplating at different deposition potentials from a bath containing 50 g/L ZnSO4•7H2O and 5.0 g/L sodium gluconate: (a) -1.1 V; (b) -1.2 V; (c) -1.3 V; (d) -1.4 V; (e) -1.5 V; (f) -1.7 V with a scan rate of 5.0 mV/sec and t = 160 sec .
Figure 8 shows the influence of the ZnSO4 content in the bath on the quantity of zinc deposited on the platinum surface at Es = -1.5 V for 160 sec at T = 25°C. It is clear that the charge consumed through peak A and hence the quantity of zinc deposited is enhanced with an increase in ZnSO4 concentration in the bath.
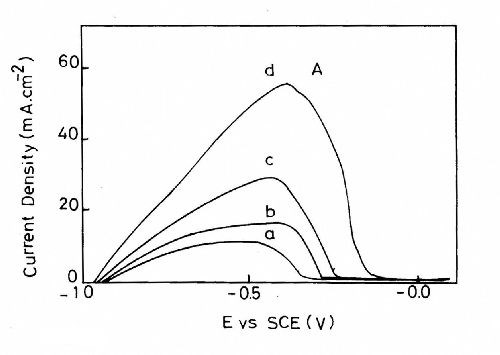
Figure 8 - Anodic linear stripping voltammetric curves for zinc electroplating baths with different ZnSO4 concentrations containing (a) 25 g/L ZnSO4•7H2O and 5.0 g/L sodium gluconate; (b) 50 g/L ZnSO4•7H2O and 5.0 g/L sodium gluconate; (c) 75 g/L ZnSO4•7H2O and 5.0 g/L sodium gluconate; (d) 90 g/L ZnSO4•7H2O and 5.0 g/L sodium gluconate at T = 25 °C, t = 160 sec and a deposition potential of -1.5 V.
The effect of gluconate concentration on anodic stripping voltammograms of zinc was also studied. The deposition of zinc was carried out onto the platinum cathode at Es = -1.5 V for 160 sec at 25°C. The stripping curves (not presented here) reveal that increasing the gluconate content inhibits the deposition of zinc since the size of the anodic stripping peak is decreased. The decrease in the quantity of zinc deposited could be due to the increase in the stability constant of the zinc gluconate complex species, which leads to a decrease in the concentration of free Zn+2 ions in the bath and consequently an increase in the cathodic polarization of zinc deposition.
Figure 9 shows the influence of the bath temperature for Bath #Zn-2 on the stripping responses. It is seen that rising temperature increases the charge consumed in the stripping process. These results suggest that the quantity of zinc deposited increases with increasing temperature.
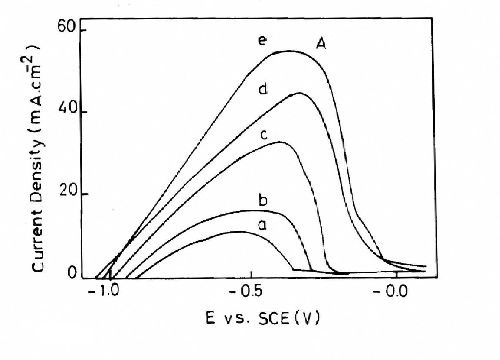
Figure 9 - Anodic linear stripping voltammetric curves for zinc electroplating at different temperatures from baths containing 50 g/L ZnSO4•7H2O and 5.0 g/L sodium gluconate: (a) 10°C; (b) 25°C; (c) 40°C; (d) 50°C; (e) 60°C with a scan rate of 5.0 mV/sec, t = 160 sec and a deposition potential of -1.5 V.
Figure 10 shows the linear sweep response obtained at different deposition times. As the deposition time increases, the peak current of peak A increases and its peak potential shifts to a more negative potential as a result of the increasing amount of zinc electrodeposited onto the cathode surface with deposition time.
.jpg;maxWidth=600)
Figure 10 - Anodic linear stripping voltammetric curves for zinc electroplating at different times from a bath containing 50 g/L ZnSO4•7H2O and 5.0 g/L sodium gluconate: (a) 160 sec; (b) 240 sec with a scan rate of 5.0 mV/sec, T = 25°C and a deposition potential of -1.5 V.
Current-time transients
Current-time transients were established to get more insight into the initial stage of nucleation and growth of zinc onto a platinum cathode surface. For this reason, a series of current-time transients were conducted at a certain potential step Es (-1.2, -1.4 and -1.5 V). The experiments were carried out in Bath #Zn-2 at T = 25°C. The results show that, in all cases, the current initially rises steeply, reaches a maximum value Im at a time tm and then decreases monotonically with time to reach the steady state deposition current Is. The values of Im and Is increase with moving the deposition potential step Es toward more negative potentials indicating the number of nuclei increases with increasing cathodic potential, as shown in Fig. 11.
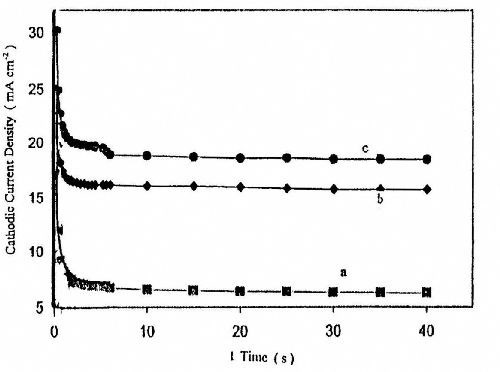
Figure 11 - Potentiostatic current-time transient for zinc electroplating at different deposition potentials from a bath containing 50 g/L ZnSO4•7H2O and 5.0 g/L sodium gluconate: (a) -1.2 V; (b) -1.4 V; (c) -1.5 V at t = 160 sec.
The initial rising current is related mainly to an increase in electroactive area, where each independent zinc nucleus grows in size and/or the number of zinc nuclei increases. When the cathode surface becomes saturated, the rate of nucleation and growth decreases and thus the current decreases gradually and finally reaches the steady state when the reactive surface area becomes constant.19,20 Plotting the rise portion of the current versus t-1/2 gives straight line as shown in Fig. 12. This linear relation assumes that the initial deposition of zinc on the surface takes place via instantaneous nucleation followed by 3-D growth under charge transfer control.21
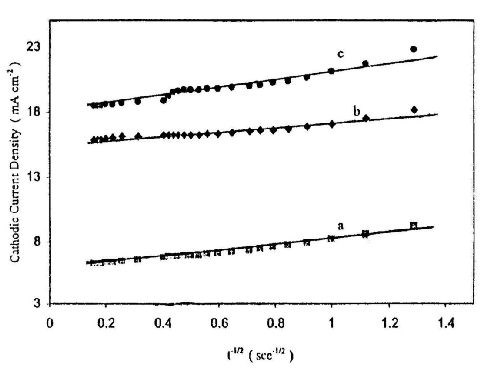
Figure 12 - Linear relationship between current density and t -1/2 at different deposition potentials from a bath containing 50 g/L ZnSO4•7H2O and 5.0 g/L sodium gluconate: (a) -1.2 V; (b) -1.4 V; (c) -1.5 V at T = 25°C.
Surface of the deposit
X-ray diffraction (XRD) examinations were conducted to show the structure of the as-deposited zinc produced from the optimum Bath #Zn-2 at 0.50 and at 0.93 A/dm2. The XRD pattern at 0.50 A/dm2 is shown in Fig. 13. Similar results were obtained at 0.93 A/dm2. It is clear from the x-ray diffraction patterns that the zinc deposit exhibits a hexagonal crystalline phase which shows a (002) preferential orientation plane with the presence of some minor peaks irrespective of current density applied. The intensities of the major and minor peaks increase with increasing the current density as a result of increasing the crystallinity of the deposits.
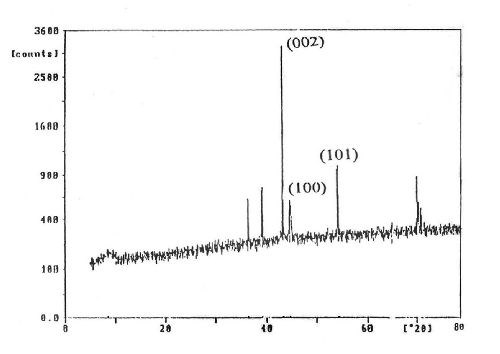
Figure 13 - X-ray diffraction patterns for zinc electroplating from a bath containing 50 g/L ZnSO4•7H2O and 5.0 g/L sodium gluconate at I = 0.5 A/dm2, T = 25°C and t = 10 min.
Throwing power and throwing index of the baths
The throwing power of zinc sulfate - sodium gluconate solutions was carried out using a Haring- Blum cell. The throwing power values (TP%) calculated by Field’s empirical formula at a linear ratio of 3:1 under different plating variables are given in Tables 2-4. Inspection of these data reveals that the throwing power (TP%) of these baths is low. Increasing the current density decreases the throwing power of the bath, as shown in Table 2, although increasing the current density enhances cathodic polarization. Increasing the ZnSO4 concentration in the bath decreases the throwing power. This could be attributed to decrease in cathodic polarization. On the other hand, increasing concentration of sodium gluconate improves throwing power of the bath. This improvement could be related to an increase in cathodic polarization as a result of a decrease in the concentration of free Zn+2 ions in the bath. Increasing the temperature leads to a decrease in throwing power, and this is related to the decrease in cathodic polarization although the increase in temperature enhances the electrical conductivity of the solution.
Table 2 - Effect of current density on the throwing power and throwing index of Bath #Zn-2 (T = 25°C, time = 10 min).
Current density, A/dm2 | TP% | TI% |
0.166 | 33.33 | 2.0 |
0.500 | 17.6 | 1.4 |
Table 3 - Effect of concentration of ZnSO4 on the throwing power and throwing index (I = 0.5 A/dm2, T = 25°C, time = 10 min).
Bath No. | ZnSO4•7H2O, g/L | TP% | TI% |
Zn-2 | 50 | 17.6 | 1.40 |
Zn-4 | 90 | 5.26 | 1.11 |
Zn-6 | 50 | 8.10 | 1.17 |
Table 4 - Effect of temperature on the throwing power and throwing index of Bath #Zn-2 (I = 0.5 A/dm2, time = 10 min).
Temperature, °C | TP% | TI% |
25 | 17.60 | 1.40 |
50 | 11.11 | 1.25 |
Figures 14-16 show some representative linear plots between the metal distribution ratio M (M = Wn/Wf) and the linear distance ratio L (1:1 - 1:3). The reciprocal of the slope of these lines is the throwing index TI. The values of TI are also listed in Tables 2-4. It is clear that the values of TI change in parallel to those calculated for TP%.
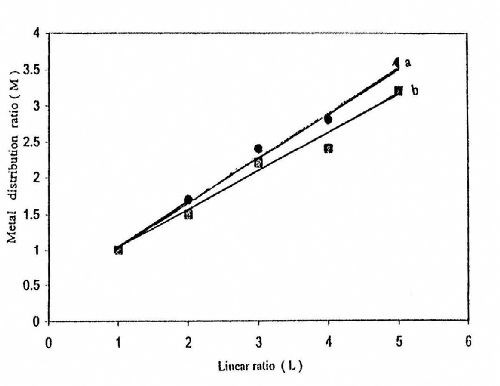
Figure 14 - Effect of current density on the throwing index from a bath containing 50 g/L ZnSO4•7H2O and 5.0 g/L sodium gluconate: (a) I = 0.5 A/dm2; (b) I = 0.166 A/dm2 at T = 25°C and t = 10 min.
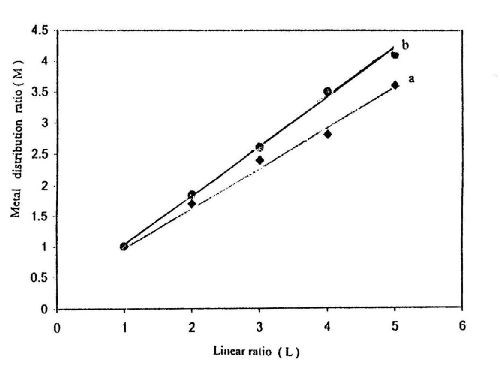
Figure 15 - Effect of sodium gluconate concentration on the throwing index from baths containing (a) 50 g/L ZnSO4•7H2O and 5.0 g/L sodium gluconate; (b) 50 g/L ZnSO4•7H2O and 2.0 g/L sodium gluconate at I = 0.5 A/dm2, t = 10 min and T = 25°C.
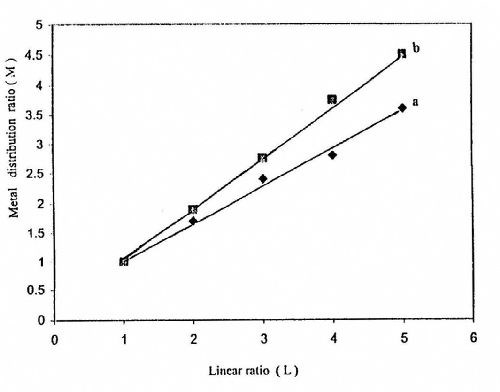
Figure 16 - Effect of temperature on the throwing index from a bath containing 50 g/L ZnSO4•7H2O and 5.0 g/L sodium gluconate: (a) 25°C; (b) 50°C at I = 0.5 A/dm2 and t = 10 min.
Conclusions
From the present work, it was found that very adherent and sound deposits of zinc onto steel and platinum substrates were produced. The optimum conditions for producing these zinc films are 70 g/L ZnSO4•7H2O, 5.0 g/L sodium gluconate, current density I = 0.5 A/dm2, pH ~ 4.5 and temperature T = 25°C. The cathodic current efficiency of zinc electrodeposition is high (95%) but less than 100% due to hydrogen evolution. The anodic linear stripping analysis suggests that zinc electrodeposited from a gluconate bath on a platinum electrode consists of only a single phase, which is confirmed by x-ray diffraction as having a (002) preferential orientation plane. The initial deposition of zinc on a platinum surface takes place via instantaneous nucleation followed by 3-D growth under charge transfer control.
References
1. F.A. Lowenheim, Modern Electroplating, 2nd Ed., John Wiley and Sons, New York, NY, 1963.
2. R.M. Burns & W.W. Bradley, Protective Coatings for Metals, Reinhold, New York, NY, 1967.
3. G.C. Ye, Y.U. Kim & D.C. Alan, Kumsok Pyomyon Choli, 18, 53 (1985).
4. I.W. Wark, J. Appl. Electrochem., 9 (6), 721 (1979).
5. N.M. Dunina, et al., USSR Technol. Organ. Proizvad., 3, 49 (1987).
6. E.A. Blount, Electroplat. Met. Finish., 23, 42 (1970).
7. H. Farid & N. Hiroomi, Met. Finish., 86, 33 (1988).
8. S.S. Abd El Rehim, et al., J. Appl. Electrochem., 24 (4), 350 (1994).
9. R.J. Brodd & V.E. Leger, Encyclopedia of Electrochemistry of the Elements - Vol. V, (A.J. Bard, Ed.), Part Zinc, Marcel Dekker, New York, NY, 1975.
10. Y.M. Polukarov & M. Gorbunova, Z. Fiz. Khim., 32, 762 (1958).
11. S.S. Abd El Rehim, et al., Electrochim. Acta, 41 (9), 1413 (1996).
12. M.M. Abou-Krisha, J. Appl. Surf. Sci., 252 (4), 1035 (2005).
13. G.M. Escandar, et al., Polyhedron, 13 (6-7), 909 (1994).
14. M. Ramasubramanian, et al., J. Electrochem. Soc., 143 (7), 2164 (1996).
15. K.Y. Sasaki & J.B. Talbot, J. Electrochem. Soc., 147 (1), 189 (2000).
16. K.E. Heusler & R. Knödler, Electrochim. Acta, 18 (11), 856 (1973).
17. T. Hurien & E. Eriksrud, J. Electroanal. Chem., 45 (3), 405 (1973).
18. N.C. Grand & J.B. Talbot, in Magnetic Materials, Processes & Devices (L.T. Romankiw & D.A. Herman, Jr. Eds.), The Electrochemical Society Soft Bound Proceeding Series, Pennington, N.J., 1990; p. 487.
19. J. Amblard, et al., J. Electroanal. Chem., 134 (2), 345 (1982).
20. J. Yu, et al., J. Electroanal. Chem., 474 (1), 69 (1999).
21. M. Sun & T.J. O’Keefe, Metallurgical Transactions B, 23 (5), 591 (1992).
*Corresponding author:
S.S.Abd El Rehim
Department of Chemistry
Faculty of Science
Ain Shams University
Cairo, Egypt
E-mail: sayedth@hotmail.com


