by Craig Leising
Nanovea, Irvine, Calif.
ABSTRACT
Shot peening is a surface modification process involving the impacting of round metal, glass or ceramic beads to impart a degree of surface roughness and/or a specified surface topography on a product surface. Three-dimensional (3D) non-contact profilometry is a significant new tool for characterizing shot-peened surfaces. This paper discusses the information that can be derived from this technique.
Keywords: shot-peening, profilometry, 3D non-contact profilometry
Introduction
Shot peening is a process by which a substrate is impacted with round metal, glass or ceramic beads, also known as shot, at a force intended to create plasticity on the surface. The characteristics present prior to and after the peening process provides vital information to better the understanding and control of the process. Among many others, surface roughness and dimple coverage area left by the shot, are of particular interest.
Importance of a 3D non-contact profilometer for peened surfaces
Unlike traditional contact profilometers which traditionally have been used to measure peened surfaces, 3D non-contact measurement provides a full 3D image to give a more complete understanding of coverage area and surface topography. Without 3D capabilities, an inspection will be solely relying on 2D information, which provides insufficient information for characterizing a surface. Understanding the topography, coverage area and roughness in 3D is the best option to control or improve the peening process. The 3D non-contact profilometers utilize chromatic confocal technology with unique capability to measure the steep angles found with machined and peened surfaces. Additionally, where other techniques fail to provide reliable data, due to probe contact, surface variation, angle or reflectivity, 3D profilometers succeed.
Measurement objective
In this application, a 3D profilometer is used to measure raw material and two differently peened surfaces for a comparative review. There is an endless list of surface parameters that can be automatically calculated after the 3D surface scan. Here we will review the 3D surface and select areas of interest to further analyze, including quantifying and investigating the roughness, dimples and surface area.
Measurement Principle
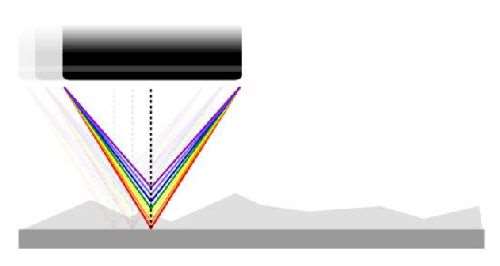
As shown in Fig. 1, the axial chromatism technique uses a white light source, where light passes through an objective lens with a high degree of chromatic aberration. The refractive index of the objective lens will vary in relation to the wavelength of the light. In effect, each separate wavelength of the incident white light will re-focus at a different distance from the lens (different height).
When the measured sample is within the range of possible heights, a single monochromatic point will be focalized to form the image. Due to the confocal configuration of the system, only the focused wavelength will pass through the spatial filter with high efficiency, thus causing all other wavelengths to be out of focus. The spectral analysis is done using a diffraction grating. This technique deviates each wavelength at a different position, intercepting a line of CCD, which in turn indicates the position of the maximum intensity and allows direct correspondence to the Z height position.
The optical pens have zero influence from sample reflectivity. Variations require no sample preparation and have advanced ability to measure high surface angles. The pens are capable of large Z measurement ranges. Any material - transparent/opaque, specular/diffusive, polished/rough - can be measured. The measurements include profile dimension, roughness finish texture, shape form topography, flatness warpage planarity, volume area, step-height depth thickness and many others.
Experimental results
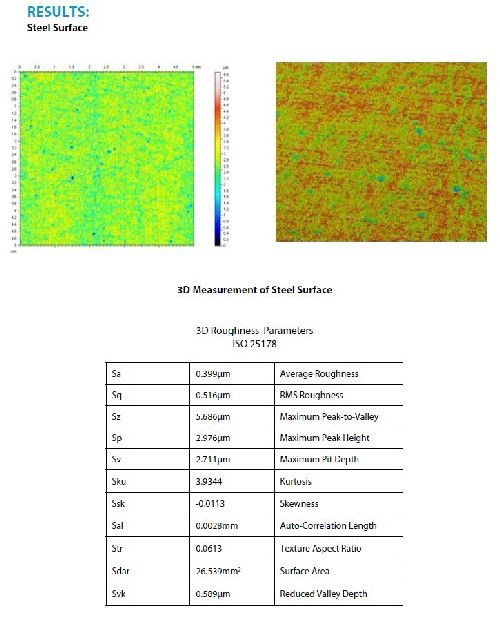
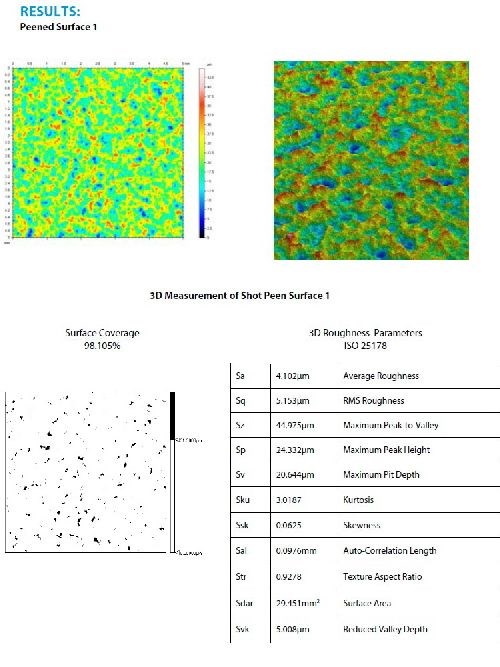
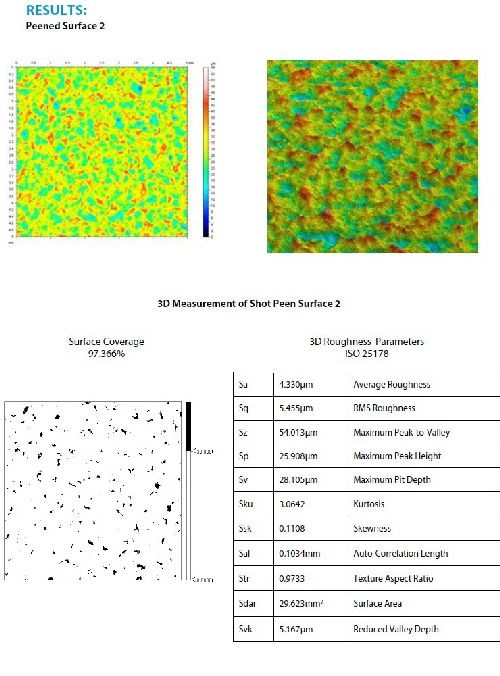
In this study, we have shown how the the 3D non-contact profilometer can precisely characterize both the topography and the nanometer details of a peened surface. As a base line, profilometry results are shown in Fig. 2 for an unpeened steel surface. Figures 3 and 4 show the results for two separate peened steel specimens, designated Surface 1 and Surface 2, respectively.
We can clearly see that both Surfaces 1 and 2 have a significant effect on all parameters reported here when compared to the raw material. The images show that Surface 1 and 2 are visually different. This is further verified by looking at the coverage area and the parameters listed. Compared to Surface 2, Surface 1 shows a lower average roughness (Sa), dents that were not as deep (Sv), less surface area (Sdar), but a slightly higher coverage area.
From these 3D surface measurements, areas of interest can quickly be identified and analyzed with a comprehensive list of measurements (dimension, roughness finish texture, shape form topography, flatness warpage planarity, volume area, step-height, etc.). A 2D cross-section can quickly be chosen to analyze further details. With this information, peened surfaces can be broadly investigated with a complete set of surface measurement resources.
Additional advantages of 3D profilometry
This study shows the potential advantages to be gained with 3D profilometry. Beyond what is shown here, additional detailed characterization can be obtained with an integrated atomic force microscopy (AFM) module. With scanning speeds ranging from 20 mm/sec to 1.0 m/sec, applications can range from laboratory research to of high-speed inspection.
Acknowledgement
A special thanks to Robert Hayden at Industrial Metal Finishing Inc., Orange, Calif., for supplying the sample used in this work.
Craig Leising has dedicated his career to metrology and surface inspection instrumentation. He has been a key player in the development of Nanovea Inc.’s Optical Profilometer line since the company’s inception in 2009. Craig has authored and collaborated on several research papers about surface measurements in various industries. He holds a bachelor’s degree in electrical engineering from the University at Buffalo.


