Application of Dynamic Impedance Measurements for Adsorbed Plating Additives
The 1986 AES Gold Medal Award was given to J.C. Farmer and H.R. (Rudy) Johnson for the Best Paper appearing in Plating and Surface Finishing in 1985. Their work presents important work on electrochemical impedance measurements, then a new technique in analyzing how plating baths and their additives work.
#research
by
J.C. Farmer and H.R. Johnson
Featured Content
Sandia National Laboratory
Livermore, California
Editor’s Note: Originally published as J.C. Farmer and H.R. Johnson, Plating and Surface Finishing, 72 (9), 60-66 (1985), and was awarded the 1986 AES Gold Medal for Best Paper published in Plating and Surface Finishing in 1985. A printable PDF version is available by clicking HERE.
ABSTRACT
Two-phase, multi-frequency AC-cyclic voltammetry (AC-CV), a novel dynamic impedance technique, was used to study the inhibition of nickel electrodeposition by 0.26 mM rhodamine-B and 0.83 mM sodium saccharin, which differed greatly in their effect and capacitance. Rhodamine-B was more strongly adsorbed over the potential range of 500 to -1000 mVSCE, during nickel electrodeposition and anodic stripping. Hydrogen evolution at a high overpotential resulted in surface roughening, as evidenced by dramatic increases in capacitance.
Introduction
Organic compounds are added to plating baths to alter the surface finish and mechanical properties of electrodeposits and probably function by preferential adsorption or electroreduction at sites of highest activity on the cathode. These additives are very dilute and are consumed by incorporation in the deposit, anodic oxidation, or cathodic reduction. Therefore, it is necessary to periodically monitor and adjust additive concentrations.
Because the effects of additives on surface finish and mechanical properties are related to changes in the double-layer structure and electrokinetic rate, precise electronic determinations of the double-layer capacitance and charge transfer resistance as quantitative measures of additive concentrations are useful. This study was undertaken to determine the sensitivity of these measured quantities to the presence of either rhodamine-B or saccharin over a broad range of potential and to gain fundamental knowledge of the electric double layer during deposition and dissolution.
The effects of rhodamine-B and saccharin on the double-layer capacitance and charge transfer resistance were measured during both anodic dissolution and electrodeposition of nickel from aqueous solutions of boric acid and nickel chloride. A novel dynamic impedance technique - two-phase, multi-frequency, AC-cyclic voltammetry (AC-CV) - was employed. Boric acid and nickel chloride were chosen for study because they are ingredients in the popular Watts bath.1 Boric acid is used as a buffer and the chloride anion assists in the corrosion of passivated anodes. Saccharin is a commonly used stress-reducing additive for nickel baths.2 Rhodamine-B has been found to be an effective brightener for lead and nickel baths and has been studied on the electrode surface by spectroscopic ellipsometry.3
Bond4 has used single-phase, single-frequency AC-CV to elucidate sequential reaction steps on an electrode and Ohsaka and coworkers5,6 have used a dynamic impedance technique similar to AC-CV to study hydrogen adsorption. Nickel deposition has been investigated with AC impedance by Epelboin and coworkers, and important conclusions were drawn regarding the effects of chloride and sulfate anions during electrodeposition.7,8
The dynamic impedance measurements presented here are more limited in frequency range than Epelboin's potentiostatic impedance measurements; however, the dynamic impedance technique allowed investigation of a much broader potential range that included both deposition and dissolution. Despite limitations in frequency, precise measurements of the double-layer capacitance were possible. The charge transfer resistance was also determined but with less relative accuracy. The cyclic method employed here is novel and represents the first reported application of a dynamic impedance technique to the study of adsorbed organic additives during electrolytic deposition.
Experimental procedure
Electrolyte concentrations were 0.5M H3BO3, 0.25M NiCl2, and either 0.26 mM (0.13 g/L) rhodamine-B or 0.83 mM (0.2 g/L) sodium saccharin. Stock solutions had a pH of 4.5 and were prepared from reagent-grade chemicals and deionized, distilled water. The cell volume was about 200 mL and was purged with N2. The cathode was a platinum rotating disc electrode (RDE) with 0.5 cm2 of active area and driven at 2000 rpm by a Pine Instruments Model ASR analytic rotator. Nickel-reduction kinetics are slow and this rotation rate was sufficient to insure that the deposition was not mass-transfer controlled.
The circular platinum sheet was embedded in Teflon and polished mechanically with 0.05-μm abrasive particles. The anode was 99.999% nickel and had a surface sufficiently large that its impedance could be neglected. All potentials were referenced to a saturated calomel electrode (SCE) that had a porous plug junction (Fisher Cat. No. 13-639-51). Anode purity was verified by flame emission, stock solution purity by a differential pulse polarography unit,* and deposit purity by energy-dispersive analysis of x-rays (EDAX).
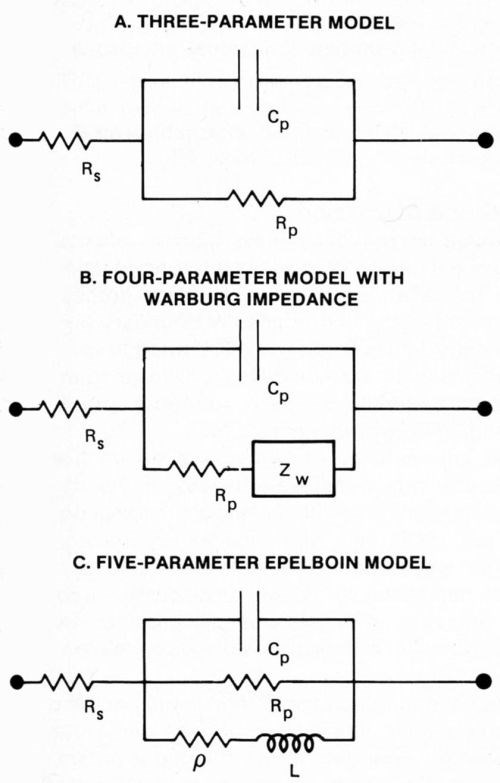
The RDE potential was controlled using a potentiostat equipped with a digital coulometer. A programmer applied a ramp potential (500 to -1000 mV at 50 mV/sec) to one signal input of the potentiostat while a Schlumberger Model SG1271 variable-frequency/variable-amplitude oscillator applied a sinusoidal modulation (100 to 1000 Hz at 10 mV rms) to the second signal input (Fig. 1). The resulting wave form of the RDE potential was that of a high-frequency modulation superimposed on a slowly swept ramp. Because faradaic and capacitive current responses to the modulation were separated in phase by 90 degrees, they could be detected simultaneously with a dual-channel, lock-in amplifier and recorded as the potential was ramped. Several cycles, each at a different modulation frequency, provided impedance data that were fit to simple equivalent circuit models (Fig. 2). Data points were digitized and fit to the model at 100-mV intervals, and more frequently where abrupt changes in response occurred.
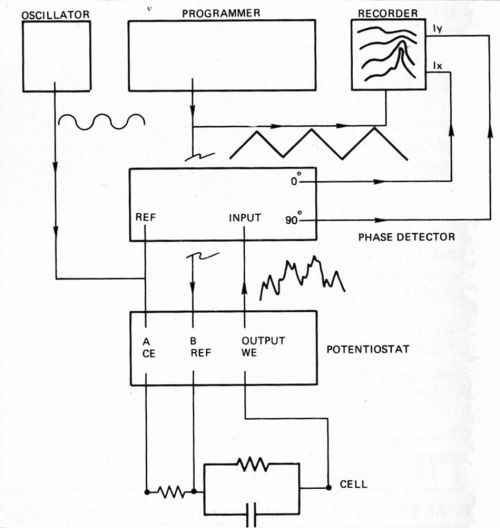
Figure 1 - Electronic instrumentation for the AC-CV technique.
Hi-Lite this text then type your caption here.
Figure 2 - Equivalent circuit models to fit dynamic impedance data include a three-parameter model (A), a four-parameter model with Warburg impedance (B) and a five parameter Epelboin model (C).
Interpretation of double-layer capacitance
Electroplaters have long used measurements of bath surface tension as an indication of additive concentration.9 The surface charge density of an interface and its surface tension are related through the electrocapillary equation. Since the double-layer capacitance is defined as the gradient of the surface charge density with respect to potential, it is reasonable that precise measures of double-layer capacitance might serve the same purpose as surface tension measurements. Although surface tension measurements are typically used for wetting agents, stress-reducing agents like saccharin and brighteners such as rhodamine-B are also surface active and therefore are expected to alter capacitance.
To appreciate the effect of adsorbed additives on the measured double-layer capacitance, the structure of the double layer must first be understood. The Poisson-Boltzman equation is used as the basis for calculating the potential change across both the diffuse region of the double layer,10 and the Stern modification of the Gouy-Chapman model (GCS model) allows the incorporation of a monomolecular film of specifically adsorbed ions or molecules into the overall double-layer model; this film is known as the compact double layer (Helmholtz layer). With knowledge of the potential at the plane separating the diffuse and compact regions of the double layer (outer Helmholtz plane), electrokinetic rate constants for double-layer effects can be corrected through the application of Frumkin factors.10 Because the double-layer capacitance is related to the potential at the outer Helmholtz plane, values of Cp are useful in calculating Frumkin factors.
Stern's concept of the compact and diffuse double layers treats their individual capacitances like "capacitors in series":
(1)
The capacitance of the compact layer, CH, is assumed to be potential independent and the capacitance of the diffuse region, Cp, increases with ionic strength and electrode polarization until its contribution to the overall capacitance becomes insignificant. If the ionic strength is great enough the diffuse layer contribution to the capacitance can be ignored.
If the composition of the compact double layer is assumed to vary with potential as governed by an appropriate isotherm, the double-layer capacitance is modeled as "capacitors in parallel." For a compact double layer composed of only two components, the overall capacitance can be calculated from contributions of the constituents."
(2)
where θ1 is the fractional coverage of the electrode by species 1, C1 is the double-layer capacitance of the electrode saturated with species 1 (θ1 = 1), C2 is the capacitance of the electrode in the absence of species 1 (θ1 = 0) and Cp is the capacitance at intermediate coverages (0 < θ1 < 1). Note that C1 is the capacitance of the electrode saturated with adsorbed additive and C2 is the capacitance in the absence of adsorbed additive. Because C1, C2, and Cp all can be measured experimentally by AC-CV, θ1 can be calculated from Eq. 3, which was derived from Eq. 2.
(3)
Impedance theory and modeling
The analysis of AC-CV data requires that the complex impedance, Ẑ, be calculated from measured values of the in-phase and out-of-phase current responses, Ix and Iy, respectively.
(4)
where Erms is the rms amplitude of the modulation voltage and j has its usual meaning, √-1.
Equation 4 can also be written in another form:
(5)
where Zx and Zy are the real and imaginary parts of Ẑ, respectively.
The overall electrochemical cell exhibits the same complex impedance at high frequencies (greater than 100 Hz) as the equivalent circuit shown in Fig. 2a. This simple, equivalent circuit model predicts the cell response more accurately at high frequencies than at low ones. This is because the Warburg impedance and self-inductance due to electrosorption may become significant at low frequencies7,8 (Figs. 2b and c). The equation describing the, impedance is then:
(6)
where Rs represents the resistance of the bulk electrolyte (plating bath), Rp represents the resistance to charge transfer at the cathode surface, Cp represents the double-layer capacitance, and ω is the angular modulation frequency (2πf). Adsorbed organic plating additives increase Rp by blocking sites for metal deposition on the cathode and decrease Cp by reducing the surface charge density on the cathode.
With AC-CV, values of Zx and Zy are obtained as a function of ω over a broad range of potential. At any potential, Rs and the product RpCp can be calculated from Zx, Zy and ω by fitting data to Equation 7 with linear regression.
(7)
Then, an average value of Rp can be calculated from measured values of Zy and the product RpCp using Equation 8.
(8)
Ideally, Rp should be frequency independent, and a single value of Zy at a single frequency, ω, should be sufficient for its calculation, given RpCp. However, by averaging several calculated values of Rp, each corresponding to a different frequency, statistical errors and bias can be reduced. Additional values of Rp could be included in the averaging if Zx values are also used.
(9)
Mansfeld, et al., also presented comprehensive discussions on the analysis of impedance data.12,13
Results and discussion
We elected to minimize mass-transfer effects so that impedance data could be easily interpreted using Equations 7,8 and 9. To make sure that the electrode processes were independent of the hydrodynamic boundary layer, cyclic voltammetry curves obtained at RDE rotation speeds of 500 to 2000 rpm were examined (Fig. 3). It was found that a wave forms were essentially identical and therefore independent of hydrodynamic effects.
Other important conclusions were drawn from cyclic voltammetry data like those presented in Fig. 3. During a single potential cycle with a cathodic reversal potential of -1000 mVSCE, the nickel deposited in the absence of inhibitors would be 123 Å thick, assuming a uniform, compact layer. As will be discussed, a roughness factor (increase in active area) as great as 4× can be measured for such thin films with capacitance measurements.
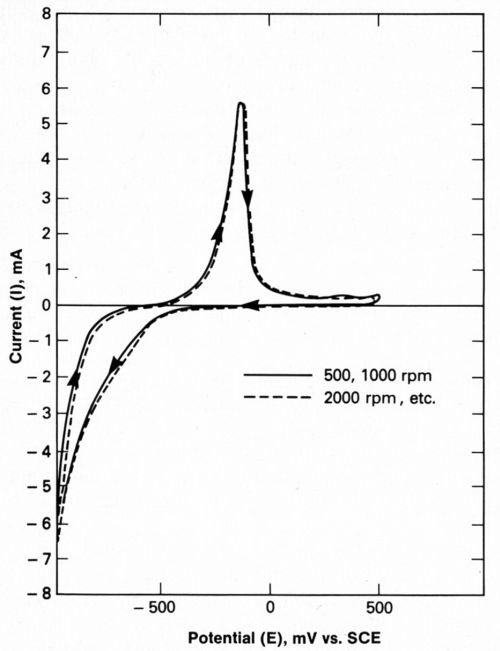
Figure 3 - Typical cyclic voltammetry with platinum rotating disc electrode at various rotation speeds, illustrating that deposition is not under the influence of mass transfer.
By comparing integrated cathodic and anodic currents, relative coulombic efficiencies for hydrogen evolution and nickel deposition were determined. During a potential cycle with a cathodic reversal potential of -1000 mVSCE, nickel deposition efficiency was 66%. At less cathodic reversal potentials substantially less H2 was generated.
Cyclic voltammetry was also used to determine rhodamine-B and saccharin concentrations at which maximum inhibition of nickel deposition occurs. A rhodamine-B concentration of 0.26 mM (0.13 g/L) resulted in the maximum inhibitory effect, which was quantified by measuring the charge underneath the anodic stripping peak for nickel at various additive concentrations. Therefore, it was assumed that at a bulk concentration of 0.26 mM, the electrode was saturated to the extent possible with adsorbed rhodamine-B. Similarly, a saccharin concentration of 0.83 mM (0.2 g/L) resulted in the maximum inhibitory effect.
The faradaic and capacitive current responses, Ix and Iy, are shown in Fig. 4 for an entire potential cycle in the absence of additives and with a modulation frequency of 100 Hz. This figure illustrates the wave forms obtained during AC-CV. Arrows indicate the direction of the potential sweep. Increases in Ix as the potential was swept cathodically from -500 to-1000 mVSCE, are due to the deposition of nickel and the evolution of hydrogen. The plateau in Ix as the potential was swept anodically from -500 to -200 mVSCE, is attributed to the formation of a passive hydroxide film on the nickel deposit, and the peak at 0 mV is believed to be due to active dissolution of nickel after the film is destroyed. Destruction of the hydroxide could result from either corrosion by chloride anion or dissolution during relaxation of the pH at the cathode surface.
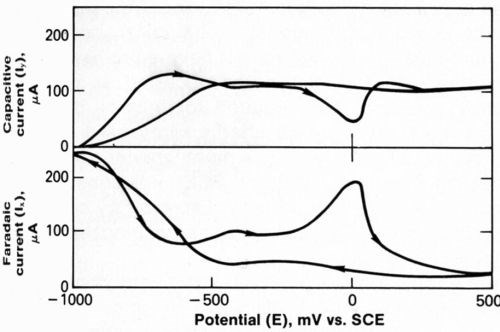
Figure 4 - Faradaic and capacitive current responses to 100-Hz modulation frequency during complete potential cycle.
Formation of Ni3O4 would require an anodic potential of about +1000 mVSCE.14 Formation of other oxides would require potentials that would result in decomposition of the electrolyte. However, if the hydrogen evolved during the cathodic portion of the AC-CV caused a shift in pH from 4.5 to 6 at the electrode surface, Ni(OH)2 could be formed at a potential near -500 mVSCE. Therefore, the passive layer is believed to be composed of hydroxide. It is assumed that chromium would disrupt the hydroxide layer in much the same way that it disrupts an oxide film on a typical nickel anode. An alternate explanation for surface reactivation would be a relaxation of pH at the surface to more acidic levels, resulting in dissolution of the hydroxide film.
AC-CV data were obtained for modulation frequencies of 100 to 1000 Hz, with the most prominent stripping peak appearing at 100 Hz (Fig. 5). Scans such as this were digitized and used to compute the series resistance, Rs, charge transfer resistance, Rp, and double-layer capacitance, Cp, as functions of potential. Values of Ix and Iy were converted to Zx and Zy and then fit to Equation 7 by linear regression, as described previously.
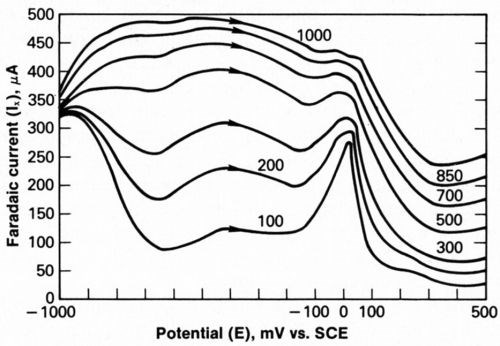
Figure 5 - Faradaic current response to 10-mV rms modulation voltage at frequencies of 100 to 1000 Hz during anodic stripping without additive.
Because the reduction potential of Ni+2 is approximately -490 mV, decreases in Rp at more cathodic polarizations must be due to nickel deposition (Fig. 6). Inflections in Rp at potentials anodic to -490 mV may be due to underpotential nickel deposition on the platinum electrode. Such phenomena have been discussed.15 The addition of either rhodamine-B or saccharin increases Rp over the entire potential range because these additives block active sites on the cathode. Note that Rs is independent of electrode potential, as it should be.
As previously discussed, two anodic processes are evident in Fig. 4. Consistent with Figs. 4 and 5, these two processes are also seen in Fig. 7, a plot of log Rp vs. E. In the absence of additives, a plateau extends from -500 to -200 mV and a peak is centered at 0 mV. The passive hydroxide film that is believed to form at -500 to -200 mV on the deposited nickel is either dissolved or attacked by corrosive Cl¯, which initiates rapid dissolution of the deposit. Thus, a sharp anodic peak is observed at 0 mV. The reasons for this interpretation are given here.
Kinetic processes on an active surface would give a linear plot of log Rp vs. E, whereas processes limited by a passive layer would be characterized by a resistance independent of potential (i.e., Ohm's law). The plateau represents a potential-independent resistance and is therefore believed to be due to the presence of a passive film. Segments of the peak represent a linear relationship between log Rp and E and thus represent a kinetically controlled process. Two anodic processes also occur in the presence of saccharin; unfortunately, the relatively poor resolution of Rp obscures the plateau. Both processes were distinctive in the original data taken with saccharin added. The plateau was not present in data when rhodamine-B was added.
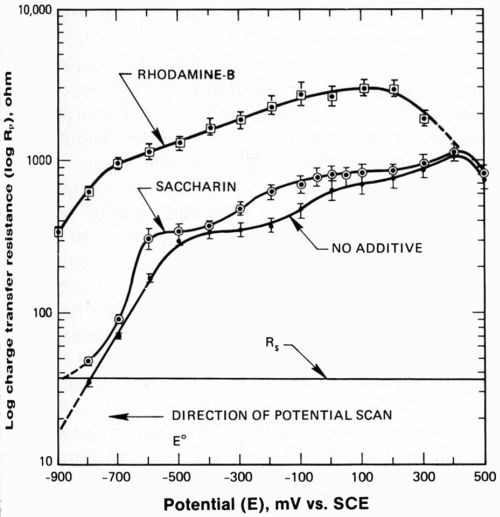
Figure 6 - Charge transfer resistance during cathodic portion of potential cycle. Cell resistance is also shown for contrast.
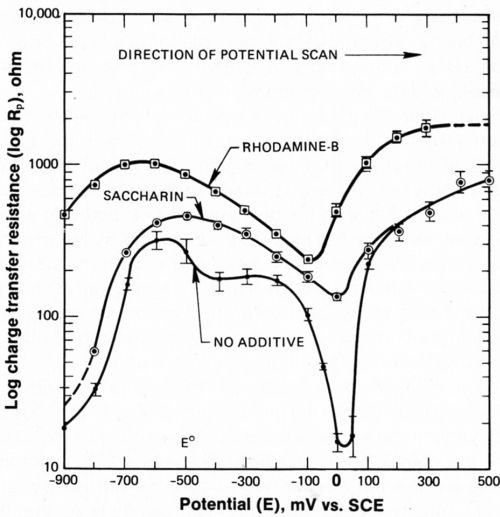
Figure 7 - Charge transfer resistance during anodic portion of potential cycle showing two steps in deposit dissolution.
Adsorption of rhodamine-B or saccharin on the electrode decreases the double-layer capacitance over the entire potential range investigated (Fig. 8). Data are for saturation levels of these additives. This reduction in the double-layer capacitance is due to the displacement of relatively small, charged ions from the electric double layer by the organic molecules. Rhodamine-B is nearly 25 Å along its greatest dimension but carries only a single positive charge. Figure 8 also shows that saturation of the electrode with rhodamine-B results in a greater displacement of charge than saturation of the electrode with saccharin.
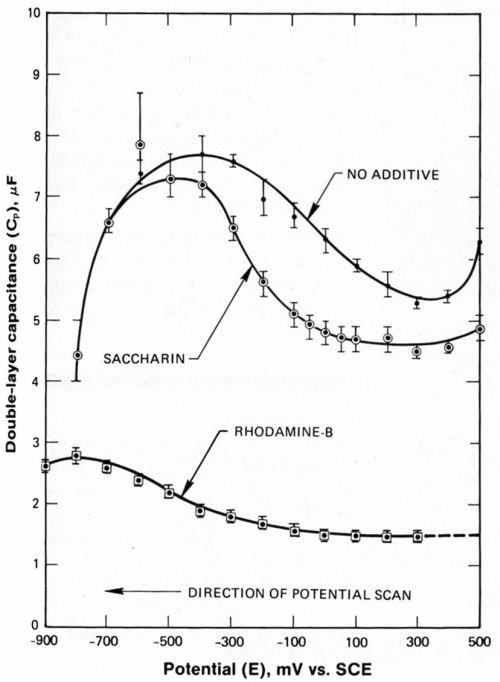
Figure 8 - Double layer capacitance during cathodic portion of the potential cycle. Note suppression of Cp by adding saccharin and rhodamine-B.
If the electrolyte had been of lower ionic strength, the minimum observed in the plot of Cp vs. E (Fig. 8) at +300 mVSCE, and in the absence of additives would have indicated that the point of zero charge (PZC) was at this potential. However, the ion concentration and the diffuse double-layer capacitance, Cp, were both sufficiently large that the second term of Equation 1 was insignificant. Therefore, the minimum in the capacitance-potential curve must have been due to changes in composition of the compact double layer induced by changes in electrode potential.
As the electrode potential was swept from +300 mV (Cp minimum of 5.3 microfarads) to -400 mV (Cp maximum of 7.7 microfarads) the electrode is believed to have become saturated with Ni+2. Saturation occurred at a potential slightly anodic to that required for bulk nickel deposition. Furthermore, because saccharin suppressed Cp at the minimum (+300 mVSCE) to a much greater extent than it did at the maximum (-400 mVSCE), it is concluded that saccharin was at least partially displaced by competitive adsorption with Ni+2 at potentials approaching that required for bulk nickel deposition.
Apparently, rhodamine-B was more tightly bound to the electrode and was not displaced by Ni+2 species. This may be due to the rhodamine-B molecule's cationic charge; saccharin would be attracted by coulombic forces (first-order effect).
The maxima in the capacitance-potential curves with saccharin and without additives (Fig. 8) coincide roughly with the onset of bulk nickel deposition and are attributed to the saturation of the electrode with Ni+2. At potentials cathodic to these maxima, values of Cp drop with increasing cathodic overpotential. These drops in capacitance are believed to be due to the depletion of the electrosorbed Ni+2 species from the surface by complete reduction, resulting in the generation of additional active sites on the electrode. A maximum in the curve for rhodamine-B is also observed but is less dramatic due to the suppression of Cp, over the entire range of potential.
Impressive increases in Cp, in the absence of either of the organic additives and at potentials more cathodic than -900 mVSCE (Fig. 9), are correlated with the onset of significant H2 evolution. Such large increases in capacitance are attributed to increased active surface area (roughness) due to hydrogen-related pitting. Referring to the curve for no additive in Fig. 9, values of Cp, remain relatively large (24 microfarads) until the deposit is stripped from the platinum surface during the anodic portion of the potential cycle. After removal of the deposit, Cp returns to values characteristic of the bare platinum surface (6 microfarads).
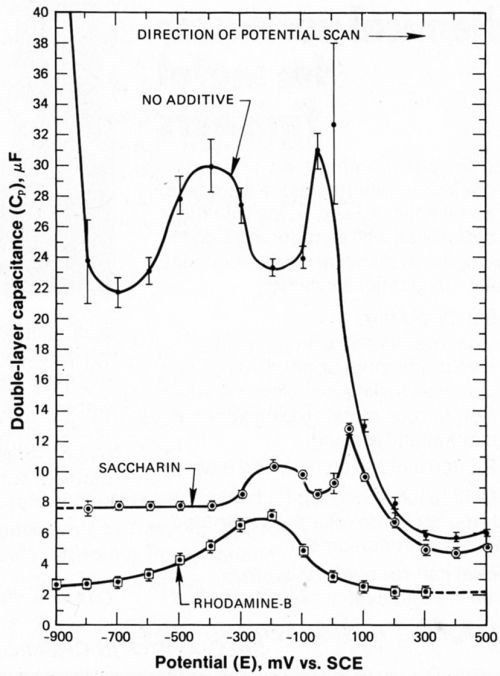
Figure 9 - Double-layer capacitance during anodic portion of potential cycle.
Assuming that Cp is proportional to surface area in this particular instance, these data indicate a roughness factor of 4× in the absence of additives. In the presence of saccharin, a roughness of 1.5× is deduced from capacitance measurements. In the absence of saccharin, the total nickel deposited during a potential cycle corresponds to a compact film thickness of about 123 Å (54 atomic layers) as noted previously, but less nickel (about 40 Å) is deposited during a potential cycle when saccharin is added to the electrolyte. Surface roughness in the presence of saccharin may have been greater and equivalent to that obtained in its absence if more nickel had been deposited. In the presence of rhodamine-B, even less nickel was deposited during a potential cycle (about 10 Å, or 3 atomic layers). Therefore, little roughening was observed in the anodic capacitance-potential curve
The peak in the anodic capacitance-potential curve (Fig. 9) centered at -400 mV in the absence of additives is correlated with the plateau observed in the AC cyclic voltammograms (Figs. 4 and 5). This peak in capacitance is a significant feature, accented by the bars showing data scatter. A similar peak is also observed in the presence c saccharin, but centered at -200 mV. The increase in Cp giving rise to this peak is believed to be due to adsorption phenomena associated with deposit passivation, perhaps the adsorption of a hydroxide species.
As the electrode was swept anodically, the passivated nickel deposit became activated, and the dissolution process proceeded, giving rise to the second peak appearing in the anodic capacitance-potential curve. This second peak was centered at about 0 mVSCE, in the absence of additives and a similar peak was observed in the presence of saccharin. This second peak is attributed to the adsorption of Ni+2 on the roughened nickel deposit. The Ni+2 ions had been generated during the dissolution of the activated nickel surface. As previously discussed, complete dissolution of the roughened deposit was accompanied by a dramatic drop in Cp to values characteristic of the bare platinum surface.
Based on this study, there is incentive for developing a capacitance probe for electronically monitoring additive levels (surface tension) in plating baths. Since the largest change in Cp due to the addition of saccharin occurred at about +300 mV (Fig. 8), a capacitance probe would have the greatest sensitivity to variations in saccharin concentration at this potential. By contrast, a capacitance probe for a cationic brightener like rhodamine-B would function well over the entire potential range investigated. Potentials below that required for nickel deposition are preferable because the effects of deposit roughening can be avoided.
Conclusions and highlights
This study resulted in the development of a cyclic, dynamic impedance technique (AC-CV) that was used for the simultaneous determination of the charge transfer resistance and double-layer capacitance over a broad range of potentials. AC-CV was used for accurate determinations of the double-layer capacitance (Cp) during cyclic deposition of nickel on a platinum surface with and without rhodamine-B or saccharin adsorbed to the cathode. Saccharin resulted in about a 10% reduction of the double-layer capacitance, Cp, at the minimum (300 mVSCE). Rhodamine-B resulted in a much greater reduction in Cp - a fourfold reduction over the entire potential range. The optimum potential for a capacitance probe to be used as a plating bath monitor for these additives was determined.
Partial displacement of saccharin from the electrode during nickel deposition resulted from competitive adsorption with the underpotential species, assumed to be Ni+2. By contrast, rhodamine-B was strongly adsorbed over the entire potential range and was not displaced during deposition. At high cathodic overpotentials this cathodic dye interacts with the electrode more strongly than a neutral species like saccharin, due to the coulombic attraction.
Capacitance data for the anodic potential scan were used to calculate the roughness of the deposited nickel during a single potential cycle. In the absence of saccharin, a film 123 Å in thickness was found to have an active surface 4× greater than the bare platinum surface. The roughening is believed to be due to pitting of the deposit by simultaneous H2 evolution. Less roughening and less deposition were observed in the presence of saccharin.
AC voltammograms and charge transfer resistance plots revealed two anodic processes occurring on the anodic portion of the potential cycle. As the potential was swept towards potentials anodic to -489 mV, the deposit was temporarily passivated by a hydroxide film. Eventually, at a sufficiently anodic potential, active dissolution of the deposit resumed as corrosive Cl¯ anions broke down the passive film.
Acknowledgments
This study was supported by the U.S. Department of Energy under contract DE-AC04-76DP00789. The technical advice of Alan Nagelberg and Don Nissen are deeply appreciated. Bill Bonivert and Howard Johnsen are thanked for preparing solutions. This report is based on a presentation made at Interfinish '84 in Jerusalem, Israel. The authors received the Boris and Renee Joffe Award for presenting the best paper at that international meeting.
References
1. G.A. DiBari, Metal Finishing Guidebook and Directory, Metals and Plastics Publ., Hackensack, NJ, 1978; p. 276.
2. R.B. Fischer and C.E. Ring, Plating, 43, 1338 (1956).
3. J.C. Farmer and R.H. Muller, J. Electrochem. Soc., 132, 2 (1985).
4. A.M. Bond, J. Electroanal. Chem., 50, 285 (1974).
5. T. Ohsaka, Y. Sawada, T. Yoshida and K. Nihei, J. Electrochem. Soc., 123, 9,1339 (1976).
6. T. Yoshida and T. Ohsaka, Sov. Electrochem., p. 599 (Nov. 1978).
7. I. Epelboin, M. Jousselin and R. Wiart, J. Electroanal. Chem., 119, 61 (1981).
8. I. Epelboin, M. Jousselin and R. Wiart, J. Electroanal. Chem., 101, 281 (1979).
9. K.E. Langford and J.E. Parker, Analysis of Electroplating and Related Solutions, 4th ed., Robert Draper Ltd., Teddington, England, 1971; p. 433.
10. A.J. Bard and L.R. Faulkner, Electrochemical Methods, Fundamentals and Applications, John Wiley & Sons, New York, NY, 1980; p. 542.
11. K. Katoh and M. Koseki, J. Electrochem. Soc., 131, 2, 303 (1984).
12. F. Mansfeld, Corrosion, 36, 5, 301 (1981).
13. F. Mansfeld, M.W. Kendig and S. Tsai, Corrosion, 36, 11, 570 (1982).
14. M. Pourbaix, Atlas of Electrochemical Equilibria, Pergamon Press, Paris, France, 1966; p. 333.
15. S. Swathirajan, H. Mizota and S. Bruckenstein, J. Phys. Chem., 86, 113, 2480 (1982).
Footnotes
*Model 384 differential pulse polarography unit; Model 173 potentiostat; Model 179 digital coulometer; Model 175 programmer; Model 5205 dual-channel, lock-in amplifier, EG&G Princeton Applied Research, Princeton, NJ.
About the authors


RELATED CONTENT
-
Troubleshooting Chromium Conversion Coatings on Aluminum
This paper provides processors with an extensive troubleshooting tool when conversion coating failures are encountered.
-
Electroless Nickel-plated Steel versus Stainless Steel: Case Studies
This paper highlights two case studies of manufacturers that have replaced, or done studies to replace, stainless steel with electroless nickel-plated mild steel. In both cases, cost savings could be realized while maintaining or improving product quality.
-
Chromium-free Etching and Palladium-free Plating of Plastics
Plastics are replacing metals in the manufacture of many parts, and quite often there is a need for metallic coatings on the plastics and other non-conductors. This paper will describe new processes of preparing ABS plastic substrates for subsequent metallization.


