Crack Formation during Electrodeposition and Post-deposition Aging of Thin Film Coatings - 6th Quarterly Report
This NASF-AESF Foundation research project report covers the sixth quarter of project work (April-June 2017) on this AESF Foundation Research project at the University of Houston. The objective of the work is to study fundamental and practical aspects of crack formation in electrodeposited thin films.
#nasf #research
by
Prof. Stanko R. Brankovic*
Featured Content
University of Houston
Houston, Texas, USA
Editor’s Note: This NASF-AESF Foundation research project report covers the sixth quarter of project work (April – June 2017) on our AESF Foundation Research project at the University of Houston. Access information to past project reports referred to in this paper is listed at the end of this report. A printable PDF version of this report is available by clicking HERE.
Personnel:
- Stanko R. Brankovic, P.I., Electrical and Computer Engineering and Chemical and Biomolecular Engineering, University of Houston,
- Kamyar Ahmadi, Ph.D. Student, Material Science Program, University of Houston,
- Wenli Yang, Ph.D. Student, Material Science Program, University of Houston.
Objective
The objective of the proposed work is to study fundamental and practical aspects of crack formation in electrodeposited thin films. The aim is to identify and quantify the key parameters of the electrodeposition process affecting the crack formation in thin films. This study should enable development of an effective strategy generally applicable in practice whenever electrodeposition process for crack-free films is demanded.
The activities in this period were focused on identifying the advantages of pulse deposition on the structural and compositional properties of chromium thin films. The chromium films were deposited from Cr+3-containing electrolytes (EXDBA 1411 bath with pH=5) using different pulse functions. Their composition and structure were compared to the ones deposited by the DC method.
Experimental approach
EDX measurements - data analysis.
The compositional study for the DC deposited chromium films was carried out using energy dispersive x-ray spectroscopy (see previous report). The focus in this report is on oxygen-content in chromium films. The content of oxygen in the chromium films as a function of current density used in electrodeposition process is displayed in Fig. 1(a). The observed trend shows that higher current density produces chromium films with slightly more oxygen. Overall, a relatively high oxygen content is observed (>15%) which indicates that the mechanical properties and fracture toughness of the chromium films could be significantly affected by a large atomic/volume percentage of incorporated oxygen/oxide phase. As discussed in an earlier report, the source of oxygen is related to two sources. The first is related to the electrodeposition process and results in oxygen incorporation as a part of a Cr-hydroxide phase. The second is related to the aging process where oxygen becomes a part of the Cr-oxide formed during exposure of the thin chromium film to air and ambient oxygen. In analyzing our EDX data, we assumed that the oxygen in the chromium films was mainly coming from the Cr-hydroxide incorporated during the chromium electrodeposition process. Considering that all of the films studied by EDX were about the same age (24 hr), the relative contribution of the second mechanism is assumed to be independent of the deposition current. This assumption is somewhat conditional as the structure of the film relates to the electrodeposition process and thus the speed of oxidation when exposed to air. However, we assumed that these effects were negligible and proceeded to model the oxygen content in the chromium deposit using our approach developed earlier.1
To start with the phenomenological description of the data for oxygen content in the chromium deposit we assume that the interfacial OH concentration ([OH-]i) is much larger than the one necessary for Cr(OH)3 precipitation ([OH-]i*) . The precipitation rate of Cr(OH)3 is assumed to be the rate-determining step in Cr(OH)3 incorporation, as each molecule of precipitated Cr(OH)3 is buried in the chromium deposit during electrodeposition process. This assumption is mathematically defined as:
The value of [OH-]i*, i.e., the threshold concentration of OH– at the interface for which Cr(OH)3 starts to nucleate and precipitate on growing chromium surface. It can be calculated from the definition of the Cr(OH)3 solubility product
Here, φ, F, D and δDiff, represent the current efficiency, Faraday’s constant, diffusivity of the chromium ion, and diffusion layer thickness. Following our earlier work describing the oxygen incorporation into an FeCo alloy, we assume that each of the Cr(OH)3 nuclei reaches some “average” size before it incorporates into the chromium deposit. That means that the nucleation rate of the hydroxide is determining the rate of the hydroxide incorporation into the deposit. The nucleation rate of the Cr(OH)3 is an exponential function of the supersaturation for the Cr(OH)3 precipitation process. In this case we express the supersaturation in terms of the concentration of OH– ions at the interface. We write supersaturation for Cr-hydroxide nucleation as:2
Here, the [OH-]i
The nucleation rate of Cr(OH)3 as a function of supersaturation is defined as:2
Here A is the nucleation rate constant,
In order to model our data in Fig. 1 using the expression above, we assume that the incorporation rate of Cr(OH)3 into the deposit (in mol-cm-2sec-1) is equal to the rate of hydroxide nucleation (in cm2sec-1 units) multiplied by the average size of the incorporated nucleus, NCr(OH)3, (in mol units). The incorporation rate of oxygen in mol-cm-2sec-1 units coming from the chromium hydroxide is then proportional to the incorporation rate of Cr-hydroxide itself:
To accommodate the fact that the samples for the EDX study were exposed to air and post-deposition oxidation, the final equation to fit our data has been upgraded with an additional fitting constant A which is related to the amount/percentage of oxide in the deposit due to the aging process. The final form of the model used to fit our data in Fig. 1 then reads:
O at% =
Here
Table 1 - Parameters of the model.

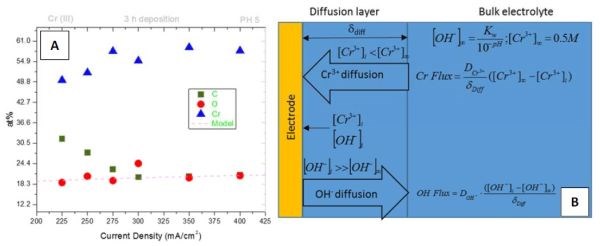
Figure 1 - (a) EDX data for composition of chromium films as a function of current density. The accuracy of EDX for light elements is ±3%. The red dotted line is the model fit eq.(7) to experimental data for at% of oxygen in the deposit; (b) schematics of the Cr+3 and OH– transport across the diffusion layer during DC chromium deposition.
As one can see, the model (eq.(7) dotted red line) succeeds to capture the experimental trend for oxygen at% as a function of the current density. At this point it is only a qualitative agreement, yet it shows that the model based on Cr-hydroxide precipitation is realistic. The good fit of the model also proves that Cr(OH)3 is the main source of oxygen in chromium films. The good agreement between the model and experimental data suggest that the precipitated hydroxide is most likely responsible for poor crystallinity of our chromium films, and mostly amorphous structure (see previous report). The metallic chromium is likely intermixed with the Cr-hydroxide phase, which results in a very small coherent length in the chromium matrix and thus the amorphousness of the films. The additional conclusion that could be derived is that the incorporated Cr-hydroxide in the chromium films is likely responsible for the cracking with the aging process. The observed tensile stress relaxation in the chromium films on room temperature aging and annealing is relatively low, within the range of 100 MPa (see previous reports). The formation of cracks therefore is a direct consequence of the low fracture toughness of the chromium films, which is induced by the poor quality of the grain boundaries enriched by the hydroxide phase. In addition to this, it is possible that significant porosity and concentration of microcrack defects is induced in the chromium films as a consequence of the Cr-hydroxide decomposition and liberation of water during the aging process (2Cr(OH)3 = Cr2O3 + 3H2O ).
XPS analysis of chromium films
During this quarter, we performed an extensive XPS analysis of the chromium films produced using both the pulse deposition and DC deposition approaches. The aim was to quantify the effect of pulse deposition on the composition of the chromium films. As expected from the initial stress data following relaxation of the chromium films (see last report), XPS measurements confirmed that pulse deposited chromium films were of better quality and, overall, exhibited less oxide/hydroxide phase. The XPS analysis also provided an opportunity to investigate the chemical state of the chromium in the films and to have a comparative analysis between the DC and pulse deposited films. These measurements also suggested that pulse deposited films exhibited more Cr-Cr metallic bonding and thus a more metallic deposit character.
XPS analysis: PC vs. DC films - peak deconvolution method
The typical XPS data/spectra for PC and DC chromium films are presented in Fig. 2. Using the peak deconvolution method, it is possible to discern the overall percentage of Cr-Cr, Cr-OH and Cr-O bonding/chemical state of chromium in each film. The results of such analysis are presented in Table 2 and they indicate clearly that PC chromium films have more chromium in the metallic state and less chromium bonded in the oxide and/or hydroxide phases. The pulse function with the longer rest time (1 sec) yields the best results with the least amount of Cr(OH)3 phase present. This result further confirms that the assumptions made in our modeling efforts were realistic. The longer rest time during the pulse stage leads to recovery of the interfacial pH and OH– species at the interface to the bulk values, thus yielding conditions for lower supersaturation upon the subsequent pulse stage and a lower nucleation rate of Cr(OH)3. Indirectly, this proves the assumption of our model that Cr-hydroxide precipitation is the main source of oxygen in the chromium deposit.


Figure 2 - XPS spectra for chromium films deposited using DC and PC methods. The peak deconvolution is presented assuming Cr(OH)3, chromium and Cr2O3 as chemical states of chromium. Jpulse = JDC = 350 mAcm-2.
Table 2 - Summary of the XPS measurements from Fig. 2.

XPS analysis: Composition depth profile
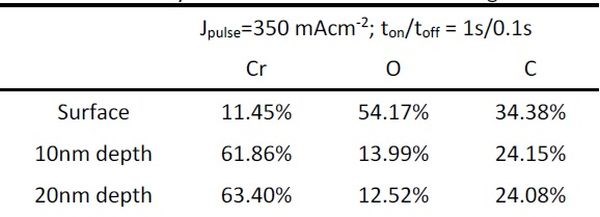
The initial XPS measurements of the composition of the chromium films yielded quite different data than what was observed from EDX analysis. The reason for this is that XPS is a surface technique, providing chemical information about the surface layer up to 5-10 nm in depth. For this reason, we performed sputter depth profiling of our samples with simultaneous XPS measurements. The samples were studied for the composition of surface, and then the chromium composition at depths of 10 and 20 nm. The XPS data for the surface for all samples showed considerably less chromium, and more carbon and oxygen for both PC and DC samples. However, at depths of 10 and 20 nm, the composition of the DC samples was consistent with previous EDX measurements, Fig. 1(a). Very little difference was found between the composition at 10 and 20 nm film depth for all samples. These results suggest that the post deposition aging (24 hr) of the sample mainly affects the near surface layer in terms of chromium oxidation by oxygen from air, as well as carbon contamination. It also indicates that the permeation of oxygen as a reactive species from air is not fast, and unless the film exhibits cracking, the composition in the bulk stays relatively unchanged. Typical data from our measurements are shown in Fig. 3 for a PC sample with ton/toff = 1 sec/0.1 sec. As evident, the spectra for the surface (black) are quite different from those at 10 and 20 nm depth. Almost no change in composition is observed between the depths of 10 and 20 nm, Table 3.


Figure 3 - The composition of chromium film obtained from XPS measurements for the surface (black), 10 (red) and 20 nm (blue) depths. The separate graphs indicate spectra for (a) chromium, (b) oxygen and (c) carbon signals. Jpulse = 350 mAcm-2.
Table 3 - Summary of the XPS measurements in Fig. 3 (Jpulse=350 mAcm-2; ton/toff = 1 sec/0.1 sec).
XPS analysis: PC vs. DC films - effect of aging
The effect of aging in air at room temperature was investigated for both DC and PC samples. The measurements were done at the surface, and at 20 and 50 nm depths. The purpose of choosing larger depth than in previous case was that the aging time was increased to one week, which was much longer than in the previous studies, where the samples were typically subjected to XPS 24 hours after deposition. In this study, the term “fresh samples” applies to XPS measurements on samples one hour after deposition. The common observation was that the DC samples contained more oxygen in the as-deposited state (fresh) than the PC samples. The chromium content was comparable, yet the PC films had a somewhat more metallic appearance. This conclusion applies to the measurements across the thickness of the chromium films (bulk). At the surface, the DC samples appeared more metallic, yet the surface of chromium films characterized by XPS, as discussed before, was not representative of the true outcome of the electrodeposition process. Interestingly, the PC samples were found to have more carbon in the film than the DC ones. The comparison of the typical DC and PC samples in the as-deposited state (fresh) and after one week of aging in air is shown in Table 4. The data for the surface of each sample are highlighted in red.
Table 4 - Summary of XPS data for DC and PC samples during aging in air for one week (Jpulse = JDC = 350 mAcm-2, ton/toff = 1 sec / 0.5 sec).
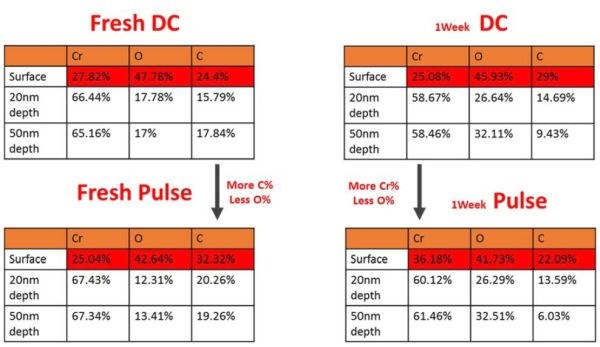

The important thing to notice from these results is that the difference in composition between DC and PC samples becomes smaller after one week of aging. One conclusion derived from these measurements is that the PC samples contain less oxygen (i.e., more metallic) than the DC samples immediately after deposition. However, when exposed to air for one week, the oxidation of the PC chromium films brings their oxygen content in PC films to a level similar to that in the DC films. Considering that diffusion of oxygen from air though the film is slow process, and that we do not see any bulk oxidation at the depth levels of 10 and 20 nm during the time span of a day (Table 3), we anticipate that the process responsible for the delivery of ambient oxygen to metallic chromium and thus Cr-oxidation is the actual formation and propagation of cracks. During the time span of a week, both DC and PC films exhibited a significant density of surface cracks which were readily observable under the optical microscope. We believe that this is the reason that the difference in oxygen composition between the DC and PC samples gradually decreased after one week of aging.
Impedance of the chromium films: upgrade of the sample holder
During the quarter, considerable effort was made to investigate the advantage of PC over DC deposition of chromium films using impedance measurements. However, the measured data experienced significant scattering, and thus there became a need for standardized measurement in terms of contact position, contact quality and sample geometry. For this reason, considerable efforts were made to redesign the sample holder for our chromium films for impedance measurements. In fact, the entire sample holder and contact assembly were completely redesigned with new geometry of the sample and holder as well (old holders/sample geometry presented in previous reports). In Fig. 4(a), the schematic of the new sample geometry and holder are presented with points indicating where the contacts are made to the chromium film surface. The fixture ensures that the distance between the electrodes is standardized and constant during each measurement. In Fig. 4(b), the actual sample in the holder position is shown with contacts attached. In Fig. 4(c), the gold-plated contacts in contact with chromium surface are shown. They are pressed against the chromium film using a set of four screws as shown in Fig. 4(b). In Fig. 4(c), the actual assembly of the sample with contacts is shown ready for measurement. In the next report we expect to show the consistent set of impedance measurements obtained using this new set-up.
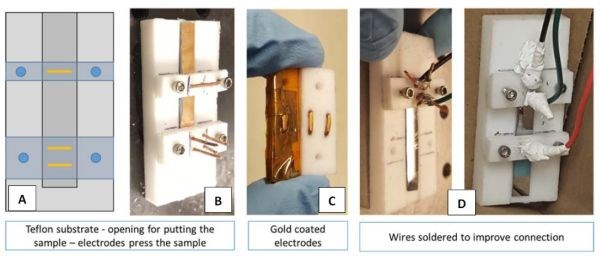
Figure 4 - The new set-up for impedance measurements.
Conclusion
The analysis of EDX data indicates that Cr(OH)3 incorporation in the chromium thin films is the main source of oxygen. The analytical model developed to analyze the oxygen content in the DC films can be used as the vehicle for development of further PC approaches to yield chromium films with better properties. The goal is to minimize the amount of hydride formed in the chromium films and to minimize the amount of oxide / hydroxide phase through the development of an effective PC deposition strategy. It seems that the PC approach yields better chromium films with less hydride and oxide phase in the as-deposited state, but with subsequent aging in air, this advantage is gradually lost, and both DC and PC chromium films exhibit similar compositional depth profiles. At this stage, it seems that the optimum PC strategy to prevent significant hydroxide incorporation might not be in accord with the optimum PC strategy to minimize the hydride formation in chromium films. This might render a need to develop a reverse pulse current deposition function which will yield optimum results when both of these problems are considered.
References
1. J. George, S. Elhalawaty, A.J. Mardinly, R.W. Carpenter, D. Litvinov and S.R. Brankovic, Electrochimica Acta, 110, 411-417 (2013).
2. J.W. Mullin, Crystallization, 4th ed., Butterworth-Heinemann, Oxford, UK, 2001; pp. 182.
Past project reports
1. Quarter 1 (January-March 2016): Summary: NASF Report in Products Finishing; NASF Surface Technology White Papers, 81 (2), 12 (November 2016); http://short.pfonline.com/NASF16Nov2.
2. Quarter 2 (April-June 2016): Summary: NASF Report in Products Finishing; NASF Surface Technology White Papers, 81 (3), 14 (December 2016); http://short.pfonline.com/NASF16Dec2.
3. Quarter 3 (July-September 2016): Summary: NASF Report in Products Finishing; NASF Surface Technology White Papers, 81 (4), 12 (January 2017); http://short.pfonline.com/NASF17Jan2.
4. Quarter 4 (October-December 2016): Summary: NASF Report in Products Finishing; NASF Surface Technology White Papers, 81 (8), 16 (May 2017); http://short.pfonline.com/NASF17May2.
5. Quarter 5 (January-March 2017): Summary: NASF Report in Products Finishing; NASF Surface Technology White Papers, 81 (11), 12 (August 2017); http://short.pfonline.com/NASF17Aug1.
About the author

*Corresponding author:
Dr. Stanko R. Brankovic
Associate Professor
Department of Electrical & Computer Engineering
Department of Chemical & Biomolecular Engineering
Department of Chemistry
N 308 Engineering Building 1
Houston, Texas 77204-4005
Phone: (713) 743-4409
Fax: (713) 743-4444
E-mail: srbrankovic@uh.edu
RELATED CONTENT
-
Evaluation of Atmospheric Corrosion on Electroplated Zinc and Zinc-Nickel Coatings by Electrical Resistance (ER) Monitoring
This paper is a peer-reviewed and edited version of a presentation delivered at NASF Sur/Fin 2013 in Rosemont, Ill., on June 12, 2013.
-
Federal Courts Stay Implementation of OSHA COVID-19 Rules
In response to a backlash of litigation, multiple federal courts have blocked implementation of OSHA and other new vaccine mandates for general industry, the healthcare industry and federal contractors.
-
Hybrid Sol-Gel Coatings in Surface Engineering
A look at the use of modified sol-gel polymer films and hybrid system coatings, as well as the methodologies for evaluating the mechanical properties of the coatings.


