
Particle Analysis Evolves with Cleanliness Specifications
Appears in Print as: 'Particle Analysis Evolves with Specifications'
Cleanliness analysis equipment has become more advanced as testing and reporting particle contamination levels have become more critical.
#measurement-testing
Share
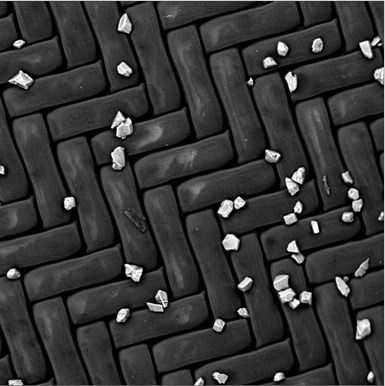
Silicon carbide particles, shown here under a microscope, can come from tooling inserts that break down over time, leaving particles behind on machined parts. (All photos courtesy of Jomesa North America.)
Today’s vehicles are produced with the most complicated, compact, fuel-efficient – and expensive to repair – powertrain assemblies than ever before. Every automotive original equipment manufacturer (OEM) must consider the potential cost of warranty repairs for each vehicle produced and, in 2018, that number was over 11 million vehicles in the U.S., according to the Bureau of Transportation Statistics. Therefore, the financial risk for these automotive OEMs is substantial.
The evolution of automotive improvements through the years has required a higher degree of contamination control throughout the manufacturing process. As a result, the powertrain manufacturing industry has gradually shifted to much more standardized and enforceable cleanliness requirements.
Featured Content


With the development of VDA 19 and ISO 16232 cleanliness standards, the automotive industry began to set new requirements for the most sensitive components, such as antilock braking systems, transmission valve bodies, fuel injection parts and bearings. To meet these requirements, cleanliness analysis equipment has become more advanced as testing and reporting particle contamination levels have become more critical.
Standards Development
Prior to the adoption of VDA 19 and ISO 16232 standards in 2004 and 2007, respectively, cleanliness “requirements” consisted mostly of visual inspection or rudimentary methods of analysis, such as weighing the contamination that was left on parts’ surfaces. These methods that may have been sufficient for some components also involved a subjective pass/fail criterion. The lack of international or industrywide standards made it almost impossible to compare results from one supplier/OEM to the next.
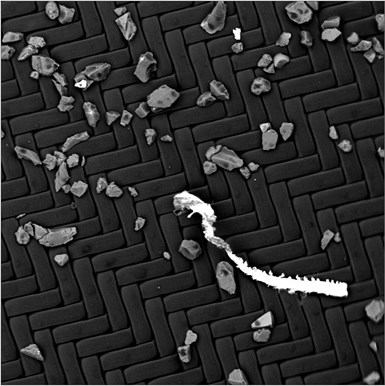
A metal chip is surrounded by aluminum oxide particles. These hard abrasive particles are detected consistently when using scanning electron microscope (SEM) technology. SEM produces images of a sample by scanning the surface with a focused beam of electrons.
Although these types of basic requirements still exist today, critical components must meet VDA 19 and ISO 16232’s stringent standards. These strict standards require limiting particle contamination to a certain maximum size as well as a distribution of particle sizes, depending on the acceptable risk of the final product. Using these standards as a reference, automotive OEMs and suppliers began to commonize test methods, allowing for requirements to be passed down the supply chain in a reliable and repeatable way.
Light-Optical Analysis
Several testing methods are available to measure and count particle contamination on critical components. Light-optical analysis is by far the most common method, and it involves four necessary parts: microscope, camera, adjustable light source (reflective light) and image analysis software. Scanners and liquid particle counters are also included.
Once a given component’s contamination particles have been extracted onto a sample filter membrane (see VDA 19.1 or ISO 16232 for a description of different extraction processes), the microscope system will take a series of magnified images and analyze the size and count of the particles present on the filter membrane. The software categorizes particles into three general bins: metal (reflective), nonmetal (nonreflective) and fibers.
To make results comparable, certain aspects of the analysis must be made standard. These are:
- Filter background must be white.
- Brightness of the image is adjusted until the maximum gray value range of the background is 55% ± 5% of the total gray value range.
- Particles to be measured/counted must be less than 70% of the maximum gray value of the image (for example, particles must not be clear, translucent or white).
Every microscope system used for cleanliness analysis must use the same settings for detecting particles against a white background. This was a critical step in the standardization of automated microscope analysis, allowing results to be compared between different manufacturers. This is also the reason that additional test methods are required when contamination particles are not detectable by the standard settings.
Extended Analysis: SEM/EDX
Standard analysis via light-optical microscopes will not reliably detect the presence of some abrasive materials that are almost white or translucent in appearance. These materials are used in many manufacturing processes (for
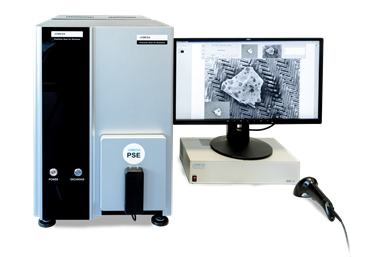
This Jomesa PSE SEM analysis system determines the type of alloys that contaminate a sample.
example, glass bead, corundum, silicon carbide and ceramics) in particle form, which can contribute to cross contamination through contact, through the air or by production processes.
To control this type of contamination, more advanced technology is necessary. SEM (scanning electron microscope) with EDX (energy dispersive X-ray) is the most suitable for measurement of metals and other hard minerals. This analysis is the next step for many manufacturers that need to record and control abrasive particles in their process or that need to be certain of the source of contamination (identifying certain metal alloys, for example).
As opposed to light-optical analysis, SEM/EDX does not rely on light or color for detection. Using special sensors, the SEM is able to generate images based on the reaction of the particles with an electron beam. Heavy elements (metals and abrasives) appear much brighter than lighter elements (carbon-based/organic particles) when using the back-scatter electron detector. The EDX detector will translate the energies produced from this reaction into a spectrum showing the elemental makeup of that particle. Using a reference database, manufacturers can compare contamination particle spectrums with known materials in the production process. With this information, the source of the contamination can be defined more efficiently.
Automated SEM/EDX analysis has not been standardized to the same level of detail as light-optical analysis, but it has increasingly become a critical step in the quality assurance process. As the demand for this type of analysis increases, more detailed standards must be developed as well.
For now, documenting and discussing analysis methods with a customer or supplier is critical in order to agree on the method used. Some microscope manufacturers have developed light-optical systems that communicate directly with an SEM/EDX system to correlate the results of both test methods. This saves a lot of time compared with the traditional SEM process and provides a more comprehensive report of the contamination on any given component.
Filter Sample Preparation
Although automated SEM/EDX analysis is relatively new to the cleanliness analysis industry, the practice of identifying particles using this technology is not. The challenge of using polyethylene terephthalate (PET or polyester) or polyamide (nylon) filter membranes in an SEM has historically created a roadblock. Because SEM systems use a beam of electrons aimed at the sample to generate images and material spectrums, these electrons need a conductive route to discharge themselves, so the images generated are clear and without “static” interference. (Imagine an old-style TV with white lines jutting across the screen randomly.) Polyester and nylon filter membranes are insulating materials by nature; in other words, the electrons are not allowed to freely discharge. Rather, they build up and create the distorted image. This effect can also cause particles to “jump” away from the filter surface.
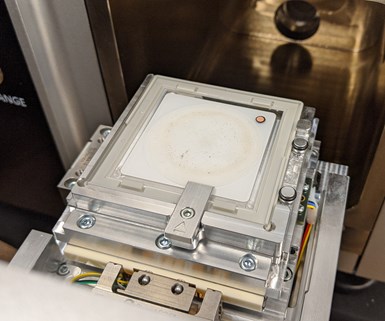
This sample is prepared to enter the SEM for analysis. SEM systems use a beam of electrons aimed at the sample to generate images and material spectrums.
However, per the VDA19 and ISO 16232 standards, particles on a filter sample must be fixated to prevent particles from jumping. With the proper fixative solution (adhesive) applied beneath the sample, particles can be analyzed in the SEM more reliably. Some manufacturers have also developed conductivity solutions that can aid in the elimination of the charging effect.
Cleanliness analysis will continue to evolve as the demands for identifying contamination grow. The cost of rework and warranty repairs far outpaces the cost of implementing efficient cleanliness analysis in the manufacturing process.
About the Author
Peter Feamster is the product management director for Jomesa North America Inc. Jomesa manufactures microscopic filter analysis equipment. Contact: peter.feamster@jomesa.com
248-457-0023
RELATED CONTENT
-
Plating Thickness Pitfalls and Measuring Instruments
Proper coating thickness is crucial in both functional and decorative plating. Here are some common problems and ways to measure coating thickness.
-
Supercar Gets Super Ecoat System
Honda builds unique ecoat system for Acura NSX at $70 million Performance Manufacturing Center.
-
Shedding Light on Surface Inspection
State-of-the-art reflector-based lighting system improves luminosity and ergonomics for surface inspection tasks while reducing energy usage.


