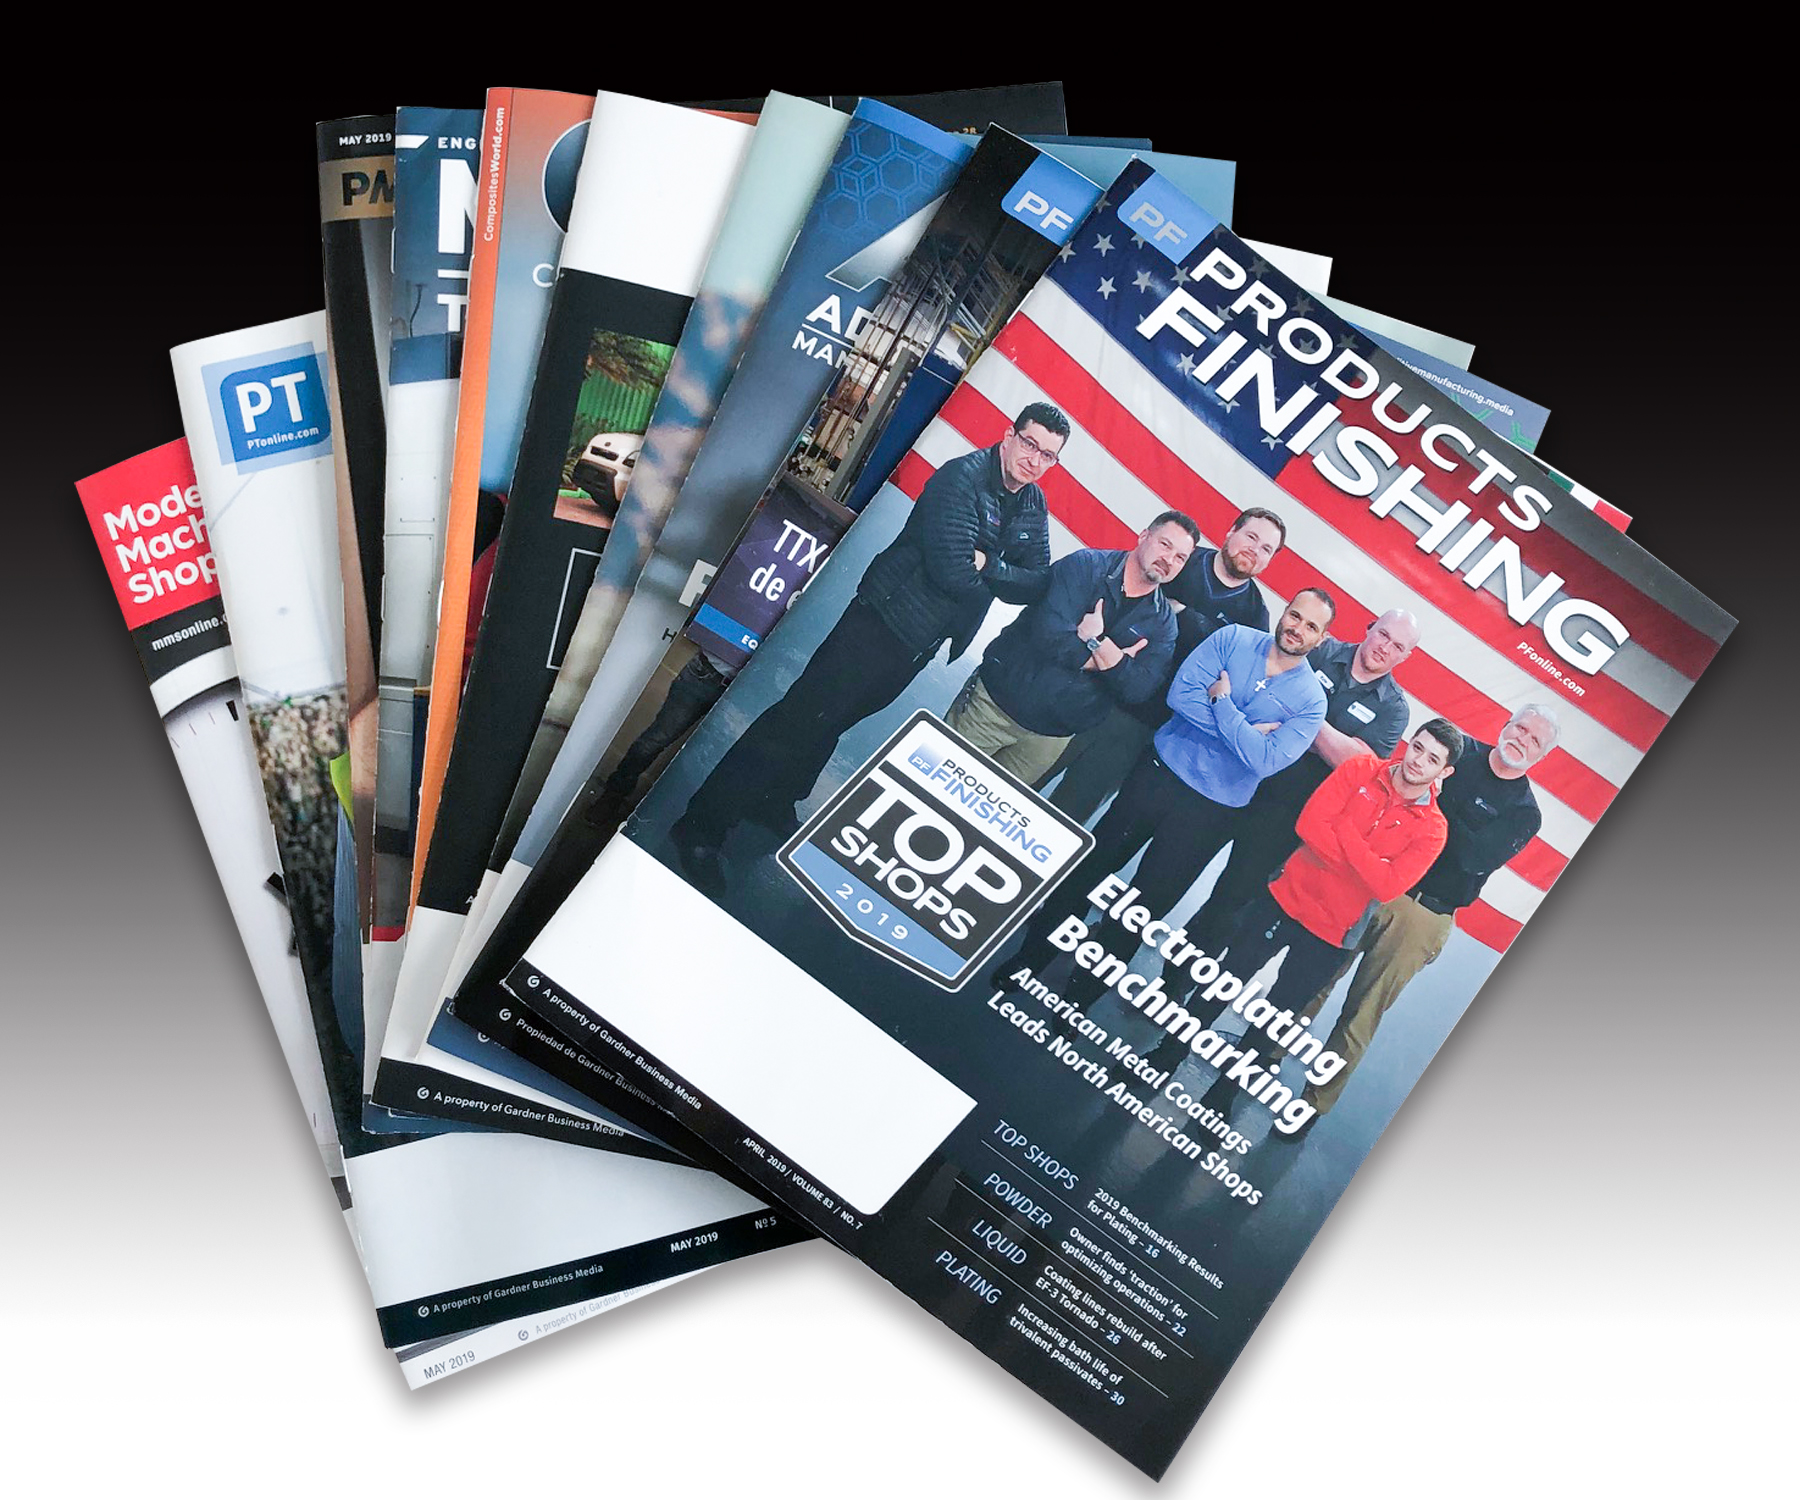
This is the sixth time that Products Finishing has conducted its annual Top Shops Benchmarking Survey for Electroplating & Anodizing. Analysts on our Gardner Intelligence team — which runs and scores the Electroplating & Anodizing survey (presented in this issue) and the Liquid & Powder Coatings survey (presented in the upcoming June issue) — have spent weeks pouring over aggregate data submitted by hundreds of survey participants across North America. They’ve looked for trends that indicate how North American finishers are performing, what’s changing and how companies can use those data to improve and grow.
Read more about specific 2020 Top Shops:
Featured Content
- Valence Surface Technologies
- A.M. Metal Finishing
- Cadillac Plating
- ChromeTech
- Lustrous Metal Coatings
2020 Results
First, to add context for this year’s results, let’s review highlights from some recent Top Shops key findings. Our 2017 report showed increased capital expenditures across the board in 2016 relative to 2015, reflecting a fairly bullish manufacturing sector. Our 2018 results showed a distinct relationship between profit and order lead time. The Gardner Intelligence team will be doing more of these relational analyses now that they have more years of data. Last year’s report showed that the North American electroplating and anodizing industry improved in areas such as order lead time and first-pass quality yield from 2017 to 2018, although other categories slipped versus the previous year. This year’s survey, which looks at metrics for 2019 relative to 2018, also shows some changes with many of the metrics remaining the same. For example:
- Median values for six of the nine metrics were relatively unchanged among Top Shops, including lead time, on-time delivery, first-pass quality yield, finishing equipment usage, environmental-management hours and formal training hours;
- For Other Shops, three of the values — lead time, first-pass quality yield and finishing-equipment usage — were also unchanged during this period;
- On the other hand, for Other Shops, five of the nine values — environmental-management hours, parts-inspection hours, analytic-testing hours, hazardous-waste management hours and formal-training hours — all increased versus the previous year;
- One important metric — on-time delivery — slipped versus the previous year for Other Shops, which could be a concerning issue if it continues;
- Among Top Shops, only analytic testing hours was lower for 2019 versus 2018 and only parts-inspection hours and hazardous-waste management hours increased from the prior year.
|
Direction of Median Values Relative Change for 2019 vs. 2018 Reporting Years |
||
|
METRIC |
TOP SHOPS |
OTHER |
|
Lead Time |
|
|
|
On-Time Delivery |
|
Concerning |
|
First-Pass Quality Yield |
|
|
|
Finishing-Equipment Usage |
|
|
|
Environmental-Management Hours |
|
|
|
Parts Inspection Hours |
|
|
|
Analytic-Testing Hours |
|
|
|
Hazardous-Waste Management Hours |
|
|
|
Formal Training Hours |
|
|
|
LEGEND: Color of boxes above indicates relative change in metric for 2019 vs.2018 Reporting Years for Top Shops vs. Other Shops Blue: No Change | Black: Decreased | Orange: Increased |
||
“In light of current workforce and economic concerns in North America, it’s somewhat surprising that in 2019, key operational metrics — including finishing equipment usage, a measurement of productivity — are generally unchanged relative to 2018,” notes Jan Schafer, director of market research at Gardner Intelligence, which is part of Gardner Business Media, the parent company of Products Finishing. “On-time delivery is an exception in that Other Shops declined on this metric, while Top Shops held steady. It’s also interesting to note that hours invested in various quality, compliance and training activities among Other Shops increased during this same period, which may reflect concerted effort by Other Shops to catch up with Top Shops in these areas. The trends in hours committed to these activities by Top Shops is more of a mixed bag. The reduction in hours of analytic testing by Top Shops and the increase in hours of parts inspection may be related.”
More Participation Next Year?
Given the amount of time and effort it takes to complete the survey, is it worth it for participating companies? “Well, for the companies involved, the personalized reports they receive that show them the specific opportunities they have to improve is really helpful,” explains Schafer. “I’ve been told that when those reports arrive at many companies, management sits down with the operations team and goes over the results and develops strategies for the coming year. There’s no place else where finishing companies can get this kind of perspective on how to improve their business — especially for free. They know we handle all their information with the strictest of confidence and we’ve carefully designed the survey to take size out of the equation, so small shops can do as well as big shops. I believe they respect the fact that we turn these data into something that’s actionable. Of course, by participating and increasing our sample size every year, companies make the survey results more robust, improving the quality of benchmarking and trend data. We encourage everyone to participate in 2021.”
RELATED CONTENT
-
Powder Coating PVC?
Question: I have a product that I am trying to get to market.
-
Automotive Powder Coating
The automotive market and its requirements for powders...
-
UV-Curable Basecoats and Clearcoats for Automotive Lighting
With the influx of plastic into automotive lighting in the early 1980s, a fresh market for coatings quickly emerged.

