2017 Finishing Industry Economic Forecast
What the team at Gardner Business Intelligence sees ahead for the industrial finishing industry in 2017.
#topshops #finishinghalloffame #vacuum-vapor
The surface finishing industry relies heavily on various manufacturing sectors to maintain growth and profitability, so it is vitally important to understand where those sectors are headed economically in order for job shops and custom coaters to have a view of what 2017 and beyond will look like.
Gardner Business Intelligence is the research arm of Products Finishing’s parent company, and we gather our data from several industries that our magazines cover, including machine tools, automotive, moldmaking, plastics, composites and more.
Featured Content
As we look to 2017 and beyond, we see a mixed bag of upward and downward trends in various manufacturing industries. The machine tool sector is recovering, but still will be slightly down for the coming year. The automotive industry is still on the rise, as is the aerospace industry.
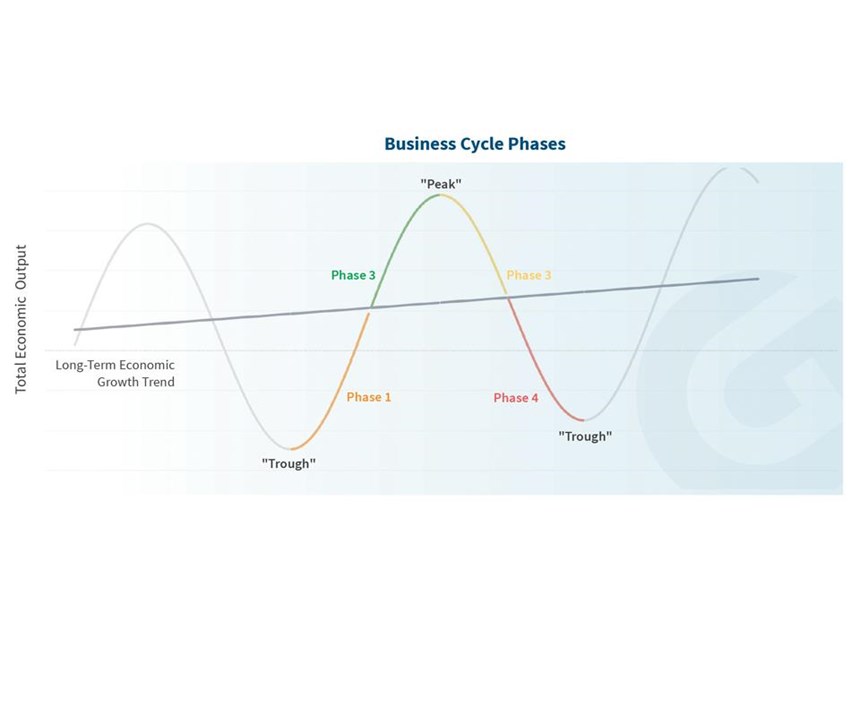
Before talking about where we see things going in 2017 from a manufacturing and subsequent surface finishing standpoint, it is important to explain a few descriptive terms. First, let’s start with defining a business cycle. The term is used to describe the actual growth of an economy around its long-term trend. In the U.S., the long-term growth trend has been around 3 percent since World War II. However, at any given time, the economy may be growing faster or slower than its long-term trend.
Typically, each business cycle has four phases that describe how the economy is doing compared to its long-term movement:
Phase 1, Early Recovery. The economy is improving from the previous recession. Prosperity and profits may be low but are improving, and the unemployment situation is also improving. Output and production levels are stabilizing or possibly increasing.
Phase 2, Late Recovery. The economy is operating above its long-term trend. Generally, businesses and consumers are doing well and are optimistic about the economy. Output and production are high. Consumers of goods and services may see prices begin to increase more than usual. Unemployment during these times is often low. The top of this phase is known as the “peak” of the economic cycle.
Phase 3, Early Recession. The start of a recession begins as the economy slows down. The rate of consumption begins to decline and unemployment begins to rise.
Phase 4, Late Recession. The economy is in a downturn with contracting business volumes, profit and worsening employment situation. The bottom of this phase is known as the “trough” of the cycle.
Understanding the cyclical nature of economic growth is an important component of forecasting. Because manufacturing durable goods involves the production of long-lasting products, this market is often highly cyclical, as consumers of durable goods often have the option to continue using older durable goods during economic downtimes rather than purchase new materials.
At Gardner Business Intelligence, our team uses statistical tools that combine the information provided by economic data along with cyclical information to build our best-in-class forecasts.
Financial
Since the election, expectations of new government spending on infrastructure and military equipment have increased expectations of future price inflation, resulting in higher borrowing costs. Reviewing the Baa industrial loan rate, borrowing rates have increased by over 24 percent since the start of November and 31 percent since September.Similar impacts are being experienced in the corporate sector, where interest rates increased proportionately. As the cost of borrowing money increases for businesses and consumers, there is a risk to the growth of the economy.
Automotive
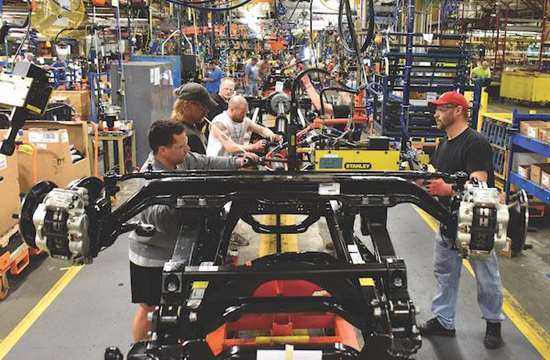
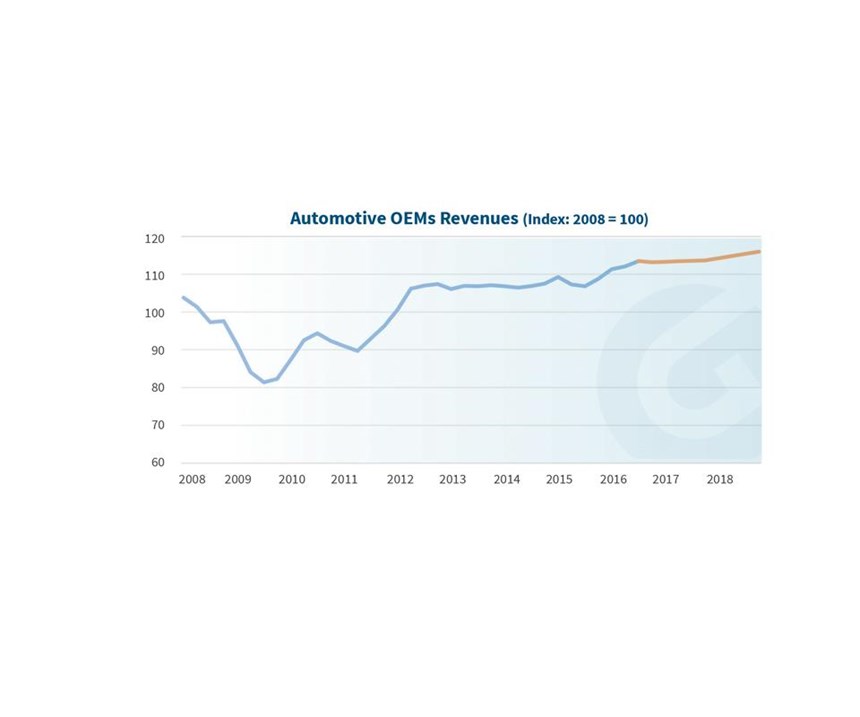
Total car and truck sales have come back to their pre-2007 highs of 18 million units annually. At current rates, total vehicle sales by year-end 2016 should reach over 17 million units. While some analysts suspect that this level is unsustainable, annual car and truck sales from 1999 to 2007 averaged 16.8 million units.
The potential for high levels of auto sales is also bolstered by the strong financial position of the average household. Between 2009 and 2013 household debt to income decreased to levels not seen since 1980, thus looking forward, households have the capacity to sustain the high level of car purchases seen in the market. Further, the increasing number of models coming to market in the next few years may create additional demand for products finishers in this industry. Expectations in the automotive market for 2018 indicate a 2-percent increase in revenues for automotive manufacturers.
Aerospace
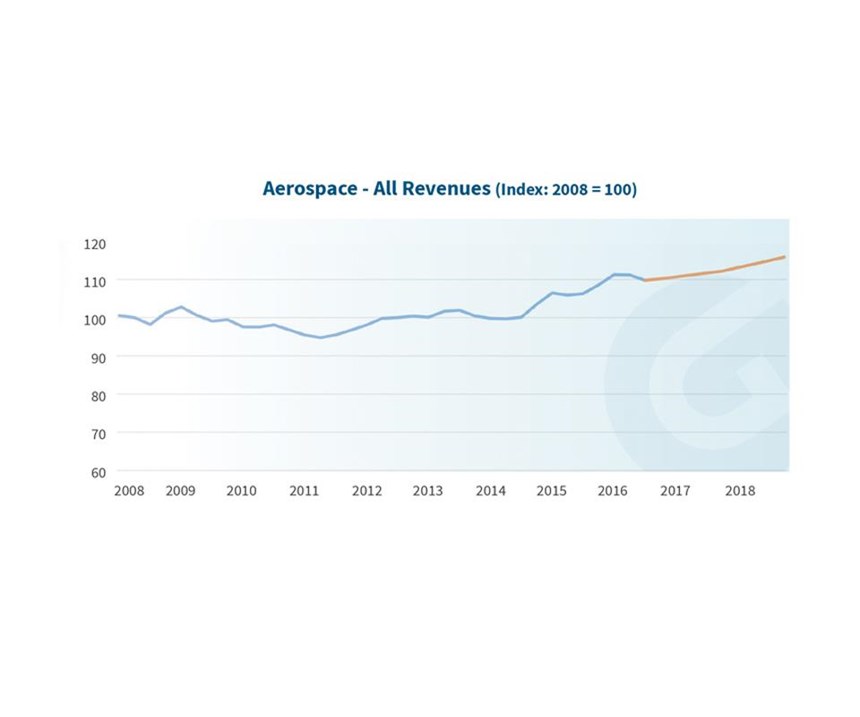
The aerospace outlook remains tempered. The consensus outlook from aviation equities analysts expect aerospace revenues to rise over 5 percent during the next two years. Backlog levels remain very high with around 10 years of backlog orders—valued at $1.9 trillion—and the latest ratio of new orders to production at parity. The number of players in the large commercial jet industry has increased from two OEMs in 2004 to five OEMS presently. There are 215 OEM customers representing a greater number and diversity of customers than in the past. Within aerospace, the engines and parts sub-sector is also expected to see modest revenue growth in 2017 and 2018. The sub-sector outlook for missiles and space products shows strong 6 percent expected revenue growth in 2017 and more modest growth of just over 3 percent in 2018.
Medical
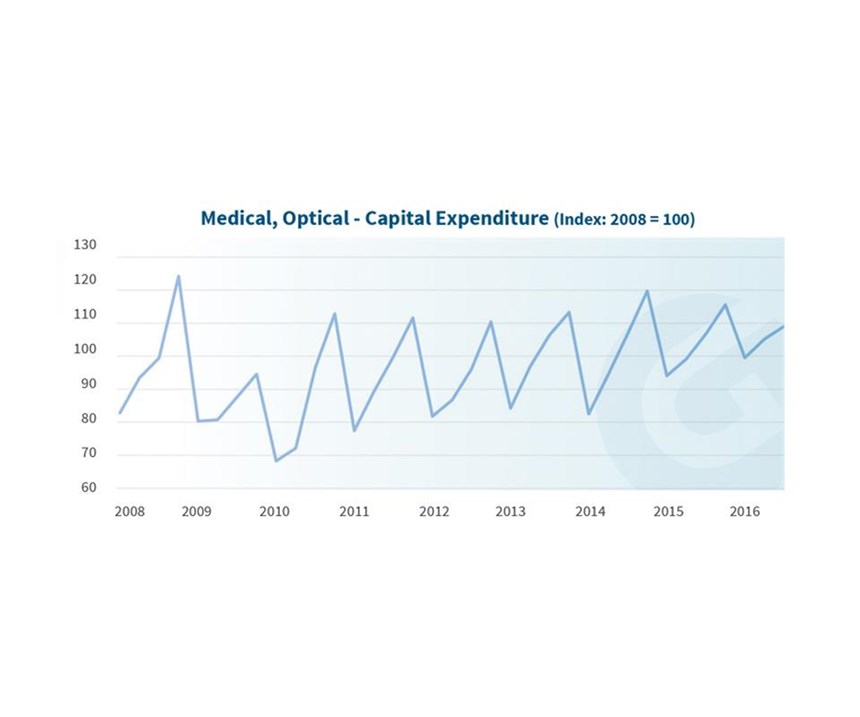
The overall medical industry continues to perform strongly with 2016 year-end revenue growth expected to be 5.8 percent. For 2017 and 2018, analysts estimate revenue growth of 6.6 percent and 4.1 percent, respectively. Capital expenditures in the industry are strongly seasonal with more capital expenditures occurring at the end of the calendar year. Between 2008 and 2016, revenues and capital expenditures across the medical industry have strongly grown. Certain medical sub-sectors, such as surgical appliances, have greatly increased their capital spending during this period, growing over 400 percent.Companies in the sector have also taken on considerable amounts of debt during the same time, which may be indicative of future growth in the industry. The surgical instruments sub-sector is also experiencing strong growth, with expectations for continued growth of 6.4 percent in 2017 and 3.1 percent growth in 2018. The forecasted numbers, however, were determined prior to the November elections. The forthcoming installment of a new president and majority Republican House and Senate will likely impact the future shape of the healthcare system. If funding for the Affordable Care Act (ACA) is cut—or if the system is substantially modified—this could have a strong impact on the medical market and the demand for downstream products and services.
The optical sub-sector is currently in a very strong growth mode. The sub-sector is expected to see growth increase 12 percent in 2017 and 6 percent in 2018. Capital expenditure in this sub-sector has been growing quickly in the last 12 months.
Machine Tools
The U.S. machine tool industry, as measured by machine tool orders (USMTO), peaked at 7.4-percent growth in September of 2014 and afterwards, experienced a trough with unit volumes down 19.4 percent in July of 2016. At present, the Gardner Business Intelligence team believes that the USMTO market has moved through the recessionary (Phase 4) period and is now in early recovery (Phase 1) of a new economic cycle for machine tools. The GBI team’s central forecast predicts machine orders from December of 2016 to December of 2017 will be down approximately 4 percent. Using one million simulations of our data and forecast, there are 80-percent odds that the actual machine tool orders rates for the period will be between +7 percent and -11 percent. On a positive note, the forecast simulations indicate a 10-percent chance of positive growth occurring as early as May of 2017. Looking at the total unit orders, the forecast model indicates that calendar year 2017 unit orders will be largely flat.
General Industrial / Durable Goods
Durable goods manufacturing hit three new all-time highs starting in June of 2014, breaking the record last set in December 2007. Since 2014, durable goods industrial production has stayed within 2 percent of that all-time high. While near its multi-year high, durable goods production is only marginally greater than its pre-2008 recession peak.
Michael Guckes is a Senior Economist with Gardner Business Intelligence, a division of Gardner Business Media, publisher of Products Finishing magazine. For additional information, please visit gardnerweb.com.
RELATED CONTENT
-
Videos: 40 Under 40 Class of 2024
In these uncertain times, it is refreshing to hear from and learn about young talent in the surface finishing industry who are striving to make a difference within their organizations and the industry as a whole.
-
40-Under-40: Class of 2018
Former Nebraska football star Brandon Rigoni leads Lincoln Industries’ business development unit, and our 2018 young professionals class.
-
Q+A: Electroplating and Anodizing Top Shop, Technical Plating
Technical Plating was recently named a Products Finishing Top Shop. We spoke with shop manager and vice president (and 40-Under-40 member) Tyler Thomas to learn more about how the shop runs.


.jpg;width=70;height=70;mode=crop)

