
Development of a Sustainability Metrics System and a Technical Solution Method for Sustainable Metal Finishing: AESF Research Project #R-121, 6th Quarterly Report
The NASF Research Board has funded a research grant at Wayne State University on sustainability in the surface finishing industry, under the direction of Professor Yinlun Huang. The objective of the work is to create a surface-finishing-specific sustainability metrics system to measure economic, environmental and social sustainability. In this report, a benchmarking study of five plants was undertaken to illustrate how the sustainability assessment works.
#nasf #sustainability #surfin
Share
by
Yinlun Huang*
Department of Chemical Engineering and Materials Science
Wayne State University
Detroit, Michigan, USA
Editor’s Note: This NASF-AESF Foundation research project report covers the sixth quarter of project work (July-September 2021) at Wayne State University in Detroit. A printable PDF version of this report is available by clicking HERE.
Featured Content


Overview
It is widely recognized in many industries that sustainability is a key driver of innovation. Numerous companies, especially large ones who made sustainability as a goal, are achieving clearly more competitive advantages. The metal finishing industry, however, is clearly behind others in response to the challenging needs for sustainable development.
This research project aims to:
- Create a metal-finishing-specific sustainability metrics system, which will contain sets of indicators for measuring economic, environmental and social sustainability,
- Develop a general and effective method for systematic sustainability assessment of any metal finishing facility that could have multiple production lines, and for estimating the capacities of technologies for sustainability performance improvement,
- Develop a sustainability-oriented strategy analysis method that can be used to analyze sustainability assessment results, identify and rank weaknesses in the economic, environmental, and social categories, and then evaluate technical options for performance improvement and profitability assurance in plants, and
- Introduce the sustainability metrics system and methods for sustainability assessment and strategic analysis to the industry.
This will help metal finishing facilities to conduct a self-managed sustainability assessment as well as identify technical solutions for sustainability performance improvement.
Progress Report (Quarter 6)
1. Student participation
Abdurrafay Siddiqui, a Ph.D. student, has been guided by the PI to continuously work on the project. As a note, Siddiqui was primarily financially supported by the PI’s NSF grant during the summer, and in the Fall semester, his study has been fully supported by Wayne State University as a Graduate Teaching Assistant.
In addition, two undergraduate students, Rebecca Potoff (Chemistry, SUNY Binghamton University) and Kiersten Patron (Chemical Engineering, University of Maryland), were recruited to participate in the project between June 1 and August 10. They were financially supported by the PI’s NSF grant for conducting research for ten weeks in the NSF REU Site Program - Wayne State University Summary Academy of Sustainable Manufacturing. The research projects assigned to them were: (1) Sustainability Assessment of Electroplating Systems and Technical Solution Identification, and (2) Data-Driven Modeling and Analysis for Environmental and Energy Sustainability Improvement in Surface Finishing and Surface Coating. The main purpose of the projects designed was to train undergraduate students in identifying sustainability issues, analyzing data, conducting sustainability assessment, and developing solution methods for sustainability improvement. It is hoped that the two undergraduate students would be interested in working in the metal finishing industry in the future.
2. Project activities and progress
In this reporting period, the PI guided students to complete a relatively comprehensive case study on sustainability assessment of five different electroplating systems. The following sections provide a detailed report of the activities.
2.1 Sustainability indicator selection
As reported in the fifth quarterly report, we have developed the first version of a sustainability metrics system, which contains 52 indicators in the economic, environmental and social sustainability categories. A comprehensive sustainability assessment on an electroplating system should include as many indicators as possible, but this will be largely dependent upon data availability. In this case study, we selected a total of 11 indicators, including four economic, four environmental and three social indicators.
For the economic category, the selected indicators were the value added (E1), the net profit margin (E2), the investment in new technologies (E3) and the product defect rate (E4). Note that the value added is the difference between the cost that consumers need to pay for a product and the cost to produce that product. The net profit margin measures the total income as a percentage of the manufacturer’s total revenue from producing and selling a product. The investment in new technology is the amount spent on new technologies each year. Finally, the product defect rate is the percent of defective products produced.
The environmental indicators used were the freshwater consumption in production per value added (V1), the wastewater generated in production per value added (V2), the fraction of water recycled in the plant (V3) and the amount of hazardous waste generated per value added (V4).
For the social sustainability category, the selected indicators were the number of complaints from customers (L1), the number of complaints from the local community (L2) and the number of process safety reviews per year (L3).
2.2 Determination of weighting factors
The weighting factors are associated with the sustainability indicators, which reflect their relative importance in sustainability assessment. The weighting factor values can be holistically determined by a method called the Analytical Hierarchy Process (AHP), which was introduced by Saaty (1980) for complex decision making, by resorting to a rigorous mathematical foundation and psychology. In this process, experienced practitioners and management personnel share their beliefs on the level of importance for individual indicators.
2.3 Sustainability performance evaluation method
Let the selected sustainability metrics set be labeled S = {E, V, L}. It contains three subsets:
- The economic subset E = {Ei, i = 1, 2, ..., NE},
- The environmental subset V = {Vi, i = 1, 2, ..., NV}, and
- The social subset L = {Li, i = 1, 2, ..., NL}.
For comparison consistency, the indicator values, Ei’s, Vi’s, and Li’s are all normalized [0, 1]; they are dimensionless. The sustainability performance of an electroplating system of interest (labeled P) can be evaluated using the following formulas:

where ai, bi and ci ∈ [1,10] are the weighting factors for economic, environmental and social sustainability, respectively. As all indicator values are normalized, the categorized sustainability values, i.e., E(P), V(P) and L(P), are all normalized.
The overall sustainability performance of the process can be calculated using the following formula:

where α, β and γ are weighting factors that range from 0 to 1. Obviously, S(P) is also normalized in the range of 0 (theoretically the lowest level of sustainability) to 1 (theoretically the highest level of sustainability).
2.4 Data collection, assessment and analysis
2.4.1 Case study data.
For the selected sustainability indicators, a number of sets of data were collected, based on our extensive literature survey, including a large number of publications by the PI’s group in the past two decades. Five sets of data were used to calculate the values of those indicators based assessment and the results are summarized in Table 1 (see the numbers in the columns labeled Case 1 to Case 5, representing five plating lines in different plants. For convenience, they are named Plant 1 to Plant 5, corresponding to Case 1 to Case 5, respectively.

Table 1 - Selected indicators and corresponding values of five cases.
All the indicator values are then normalized, based on the known indicators’ max-min value ranges shown in the second and third columns of Table 1. The normalized indicator values are omitted here.
2.4.2. Weighting factor evaluation and analysis.
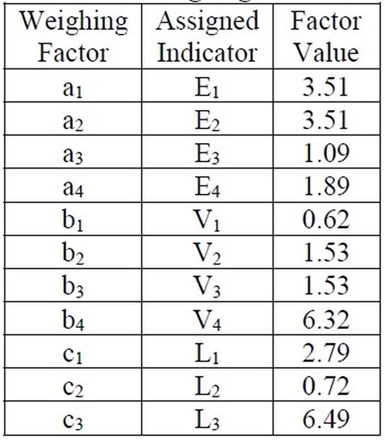
Table 2 - Weighting factors.
The weighting factors were computed using the Analytical Hierarchy Process (AHP) method. Table 2 provides a list of the weighting factors associated with individual sustainability indicators. It is observed that based on the weighting factor values, the value added (E1) and the net profit margin (E2) are equally important, and they are more important than the product defect rate (E3) and much more important than the investment on new technology (E4). The goal of electroplating industries economic interests is to increase the profit to the company, while product quality can be ensured. For environmental sustainability, since the goal is to decrease the amount of hazardous waste generated (V4), the weighting factor has the greatest value, as compared with the weights for other three indicators. For social sustainability, process safety (L1) is most focused. It is followed by customer satisfaction (L2). This priority set by a company can be reflected by the differences among the three calculated weight factor values in the table, in this case, to minimize complaints from local communities and customers with an increase in safety reviews performed.
2.4.3. Assessment result.
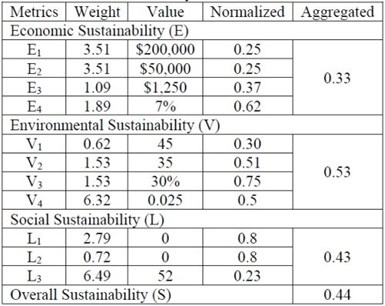
Table 3 - Sustainability assessment of Case 1.
For each of the five cases, we conducted a sustainability performance evaluation in three steps: (a) calculation of normalized indicator values, (b) calculation of the values of categorized sustainability using Eqs. (1)-(3), and (c) calculation of overall sustainability values using Eq. (4). Table 3 provides the assessment result for Case 1. As shown in the fifth column of the table, the economic (E), environmental (V), and social (L) sustainability values are 0.33, 0.53, and 0.43, respectively, and the overall sustainability (S) is determined to be 0.44.
Using the same approach, we obtained the assessment results for the other cases, which are summarized
in Tables 4.1 - 4.3. Note that the numbers are all normalized; they could be readily converted back to the numbers with units. For instance, in Case 2, E3 has a value of 0.801, which means the investment on new technology is $2,700. In Case 3, the value of V1 is 0.712, which corresponds to 20 gal/$ for the fresh water use in production per value added. In Case 4, the number of process safety reviews per year (L3) is 10, as the normalized indicator value is 0.192.

Table 4.1 - Assessment of economic sustainability of the five cases.

Table 4.2 - Assessment of environmental sustainability of the five cases.

Table 4.3 - Assessment of social sustainability of the five cases.
2.4.4. Result presentation by radar charts.
A radar chart is an informative visual tool to represent multivariable information in a 2D plane. This tool is used to plot the indicator-based categorized sustainability performance in Fig. 1, where the polygons of five different colors represent the assessment results for five cases.

Figure 1 - Representation of sustainability indicator based assessment results for five cases: (a) economic performance, (b) environmental performance and (c) social performance.
2.4.5. Result presentation using a sustainability cube.
Piluso, et al. (2008, 2010) introduced a sustainability cube as a tool to present the categorized and overall sustainability evaluation results. This graphical presentation is superior to other schemes, as (a) it uses the edges of the cube to describe the status of one categorized sustainability (composite sustainability index, (b) it can also show the overall sustainability status, and (c) it can provide a visually very convenient comparison of sustainability performances of different cases (or scenarios).
In the study of the five cases, the data for E(P) shown in Table 4.1, V(P) in Table 4.2, and L(P) in Table 4.3 are summarized in Table 5. The overall sustainability, S(P), for each case should be calculated using Eq. (4), where the weighting factors, α, β and γ, are set to 1. The evaluated S(P) values are listed in the last row of the same table. All results of the five cases are entered in the sustainability cube shown in Fig. 2.

Table 5 - Sustainability performance assessment.

Figure 2 - Sustainability performance summary of five cases.
2.4.6. Analysis and improvement opportunity identification.
From Table 5 and Figure 2, we can observe the following performance comparisons.
(a) Economic sustainability (E). Case 4 has the best performance (with a value of 0.71), while Case 3 the worst (showing the value of 0.19). The mean of the five cases is 0.438. This is reflected by a comparison of the indicator-based assessment results shown in Table 4.1, where three out of four indicator values for Case 4 are the highest among the five cases, while three out of four indicator values for Case 3 are the lowest. If the performance of Case 4 is to be further improved, then Plant 4 should consider investment increment on new technology to improve its production efficiency. For Case 3, Plant 3 needs to find ways to improve the value added performance, the profit margin and the investment on new technologies. Note that the mean of 0.44 for all five cases is relatively low. While Case 5 is ranked the second best, Plant 5 should make a main effort on product quality improvement. The production lines of Plants 1 and 2 should develop improvement more comprehensive strategies. Overall, Plant 4 shows the “best practice” in the benchmarking effort.
(b) Environmental sustainability (V). The assessment has revealed that Case 1 is the best (with a value of 0.53), and Case 3 the worst (with a value of 0.14). Since the mean is 0.316 for all five cases, the five plants’ environmental performance is overall not satisfactory. Table 4.2 shows the details. Note that even for the best case, Case 1, three indicators (V1, V2, and V4) show values smaller than 0.51. The main problems in Case 3 are water recycling/reuse (V3) and hazardous waste management (V4). In fact, these problems also appear in Cases 2 and 5, which are serious and unacceptable, respectively. Plants 2, 3 and 5 need to find technical solutions and set up their improvement plans. Note that the high values of indicators V1 and V2 in Case 2 demonstrate a great success of Plant 2 in freshwater consumption and wastewater minimization. Their experience can be shared with the four other plants.
(c) Social sustainability (L). Based on the assessment using only three indicators, Case 2 is the best, with a value of 0.59, and Case 5 the worst, with a value of 0.16. As shown by the values of L1 and L2, Plants 1 to 4 have a strong or very strong relationship with their customers and local communities, but Plant 5 does not. As to the annual process safety reviews (measured by L3), no plant shows a significant effort, although Plant 2 is relatively acceptable. This assessment strongly suggests all to make sure that an immediate action be taken in order to avoid the occurrence of any possible safety problems in plants. Overall, the mean value for all five plants is 0.392; this is not satisfactory.
(d) Overall sustainability (S). The overall sustainability assessment is an aggregation of the results in all three sustainability dimensions. As shown in the last row of Table 5, the value range is from 0.52 (for Case 4) down to 0.27 (for Case 3). These results are plotted as five points, labeled S1 to S5 for Cases 1 to 5, respectively, in Fig. 2. Note that in the 3D space, the lower left corner has the coordinate, (0, 0, 0), which theoretically represents the lowest level of sustainability, which is completely unacceptable (Smin = 0), while in the upper right corner, the coordinate is (1, 1, 1), signifying the highest level of sustainability (Smax = 1). Clearly, all the points, S1 to S5, are far away to the point for Smax. Relatively, S5 is closest to the point for Smax, as Plant 5 is relatively more sustainable than other four plants, although the plant still has various opportunities for improvement. Note that the mean value of the overall sustainability is 0.428, which is not satisfactory.
3. Summary
The benchmarking study shows that Plant 4 shows the best sustainability performance, which is slightly better than Plants 1 and 2. Plants 3 is ranked No. 4 and Plant 5 is the last. Overall, all of these plants’ sustainability performance is not satisfactory. The analysis shown above provides a number of directions for each individual plant to investigate. As an important note, it is suggested that all plants use the same sustainability indicators to reassess sustainability performance after implementing their improvement strategies.
Although the sustainability indicators used in this case study are insufficient, the application of the sustainability assessment methodology is successful. The methodology is general, systematic and applicable to any plants and any plating lines. But for real application, it is suggested that the plant(s) should consider using many more indicators in order to conduct a more comprehensive sustainability assessment.
4. References
B. Ramesh Babu, S. Udaya Bhanu and K. Seeni Meera, “Waste Minimization in Electroplating Industries: A Review,” Journal of Envi. Sci. and Health, Part C, 27 (3), 155-177 (2009).
A., Baral, R. Engelken, W. Stephens, J. Farris and R. Hannigan, “Evaluation of Aquatic Toxicities of
Chromium and Chromium-Containing Effluents in Reference to Chromium Electroplating Industries,” Arch Environ. Contam. Toxicol., 50 (4), 496–502 (2006).
Y.N. Chow, L.K. Lee, N.A. Zakaria and K.Y. Foo, “Integrated Assessment of Nickel Electroplating Industrial Wastewater Effluent as a Renewable Resource of Irrigation Water Using a Hydroponic Cultivation System, Frontiers in Plant Science, https://doi.org/10.3389/fpls.2021.609396 (2021).
S. Liu, S.B. Mishra, Y. Zhang and L. Qi, “Uptake of Hexavalent Chromium in Electroplating Wastewater by Hydrothermally Treated and Functionalized Sand and its Sustainable Reutilization for Glass Production,” ACS Sustainable Chem. & Eng., 5 (2), 1509-1516 (2017).
Z. Liu and Y. Huang, “Technology Evaluation and Decision Making for Sustainability Enhancement of Industrial Systems Under Uncertainty,” AIChE J., 58 (6), 1841-1852 (2012).
Z. Liu and Y. Huang, “Sustainable Distributed Biodiesel Manufacturing Under Uncertainty: An Interval-Parameter-Programming-Based Approach,” Chem. Eng. Sci., 93, 429-444 (2013).
H.H. Lou and Y. Huang, “Electroplating,” in Encyclopedia of Chemical Processing, S. Lee (ed.), Vol. 2, pp. 839-848, Taylor & Francis, New York, NY, 2006.
T.L. Saaty, The Analytic Hierarchy Process, McGraw-Hill, New York, 1980.
C. Piluso and Y. Huang, “Ecological Input-Output Analysis-Based Sustainability Analysis of Industrial Systems,” Ind. Eng. Chem. Res., 47 (6), 1955-1966 (2008).
C. Piluso, J. Huang, Z. Liu, and Y. Huang, “Sustainability Assessment of Industrial Systems under Uncertainty: A Fuzzy Logic Based Approach to Short-Term to Midterm Predictions,” Ind. Eng. Chem. Res., 49 (18), 8633-8643 (2010).
5. Past project reports
1. Quarter 1 (April-June 2020): Summary: NASF Report in Products Finishing; NASF Surface Technology White Papers, 84 (12), 14 (September 2020); Full paper: http://short.pfonline.com/NASF20Sep1
2. Quarter 2 (July-September 2020): Summary: NASF Report in Products Finishing; NASF Surface Technology White Papers, 85 (3), 13 (December 2020); Full paper: http://short.pfonline.com/NASF20Dec1
3. Quarter 3 (October-December 2020): Summary: NASF Report in Products Finishing; NASF Surface Technology White Papers, 85 (7), 9 (April 2021); Full paper: http://short.pfonline.com/NASF21Apr1.
4. Quarter 4 (January-March 2021): Summary: NASF Report in Products Finishing; NASF Surface Technology White Papers, 85 (11), 13 (August 2021); Full paper: http://short.pfonline.com/NASF21Aug1.
5. Quarter 5 (April-June 2021): Summary: NASF Report in Products Finishing; NASF Surface Technology White Papers, 86 (1), 19 (October 2021); Full paper: http://short.pfonline.com/NASF21Oct2
6. About the Principal Investigator

Dr. Yinlun Huang is a Professor at Wayne State University (Detroit, Michigan) in the Department of Chemical Engineering and Materials Science. He is Director of the Laboratory for Multiscale Complex Systems Science and Engineering, the Chemical Engineering and Materials Science Graduate Programs and the Sustainable Engineering Graduate Certificate Program, in the College of Engineering. He has ably mentored many students, both Graduate and Undergraduate, during his work at Wayne State.
He holds a Bachelor of Science degree (1982) from Zhejiang University (Hangzhou, Zhejiang Province, China), and M.S. (1988) and Ph.D. (1992) degrees from Kansas State University (Manhattan, Kansas). He then joined the University of Texas at Austin as a postdoctoral research fellow (1992). In 1993, he joined Wayne State University as Assistant Professor, eventually becoming Full Professor from 2002 to the present. He has authored or co-authored over 220 publications since 1988, a number of which have been the recipient of awards over the years.
His research interests include multiscale complex systems; sustainability science; integrated material, product and process design and manufacturing; computational multifunctional nano-material development and manufacturing; and multiscale information processing and computational methods.
He has served in many editorial capacities on various journals, as Co-Editor of the ASTM Journal of Smart and Sustainable Manufacturing Systems, Associate Editor of Frontiers in Chemical Engineering, Guest Editor or member of the Editorial Board, including the ACS Sustainable Chemistry and Engineering, Chinese Journal of Chemical Engineering, the Journal of Clean Technologies and Environmental Policy, the Journal of Nano Energy and Power Research. In particular, he was a member of the Editorial Board of the AESF-published Journal of Applied Surface Finishing during the years of its publication (2006-2008).
He has served the AESF and NASF in many capacities, including the AESF Board of Directors during the transition period from the AESF to the NASF. He served as Board of Directors liaison to the AESF Research Board and was a member of the AESF Research and Publications Boards, as well as the Pollution Prevention Committee. With the NASF, he served as a member of the Board of Trustees of the AESF Foundation. He has also been active in the American Chemical Society (ACS) and the American Institute of Chemical Engineers (AIChE).
He was the 2013 Recipient of the NASF William Blum Scientific Achievement Award and delivered the William Blum Memorial Lecture at SUR/FIN 2014 in Cleveland, Ohio. He was elected AIChE Fellow in 2014 and NASF Fellow in 2017. He was a Fulbright Scholar in 2008 and has been a Visiting Professor at many institutions, including the Technical University of Berlin and Tsinghua University in China. His many other awards include the AIChE Research Excellence in Sustainable Engineering Award (2010), AIChE Sustainable Engineering Education Award (2016), the Michigan Green Chemistry Governor’s Award (2009) and several awards for teaching and graduate mentoring from Wayne State University, and Wayne State University’s Charles H. Gershenson Distinguished Faculty Fellow Award.
* Dr. Yinlun Huang, Professor
Dept. of Chemical Engineering and Materials Science
Wayne State University
Detroit, MI 48202
Office: (313) 577-3771
E-mail: yhuang@wayne.edu
RELATED CONTENT
-
RoHS and ELV Compliant Electroless Nickel
Over the past few years, a number of new environmental directives have come out of Europe and Asia encompassing mainly the automotive and electronics industries.
-
Coating Plastic Parts More Efficiently
Quality, costs and sustainability in focus with liquid coatings.
-
Nitric Acid Passivation and EH&S Impact
I am looking for safety/environmental requirements to set up a nitric acid cleaning and passivation system.


