
NASF/AESF Foundation Research Project #121: Development of a Sustainability Metrics System and a Technical Solution Method for Sustainable Metal Finishing - 11th Quarterly Report
This NASF-AESF Foundation research project report covers the 11th quarter of project work (October-December 2022) at Wayne State University in Detroit. In this reporting period, our main effort concentrated on the continuous development of a computer-aided tool for sustainability assessment and decision making, with a focus on the coding for the decision making. The tool is currently able to assess a process’ sustainability performance, after a set of sustainability indicators are selected, and plant data are input.
#nasf #sustainability
Share
by
Yinlun Huang*
Department of Chemical Engineering and Materials Science
Wayne State University
Detroit, Michigan, USA
Editor’s Note: This NASF-AESF Foundation research project report covers the 11th quarter of project work (October-December 2022) at Wayne State University in Detroit. A printable PDF version of this report is available by clicking HERE.
Featured Content


It is widely recognized in many industries that sustainability is a key driver of innovation. Numerous companies, especially large ones who made sustainability as a goal, are achieving clearly more competitive advantages. The metal finishing industry, however, is clearly behind others in response to the challenging needs for sustainable development.
This research project aims to:
- Create a metal-finishing-specific sustainability metrics system, which will contain sets of indicators for measuring economic, environmental and social sustainability,
- Develop a general and effective method for systematic sustainability assessment of any metal finishing facility that could have multiple production lines, and for estimating the capacities of technologies for sustainability performance improvement,
- Develop a sustainability-oriented strategy analysis method that can be used to analyze sustainability assessment results, identify and rank weaknesses in the economic, environmental, and social categories, and then evaluate technical options for performance improvement and profitability assurance in plants, and
- Introduce the sustainability metrics system and methods for sustainability assessment and strategic analysis to the industry.
This will help metal finishing facilities to conduct a self-managed sustainability assessment as well as identify technical solutions for sustainability performance improvement.
1. Student participation
Abdurrafay Siddiqui, a PhD student in the PI’s group, conducted research on this project in this reporting period. The student is financially supported mainly by Wayne State University’s Graduate Teaching Assistantship Program, and partially by this AESF research project.
2. Project activities and progress
In this reporting period, our main effort concentrated on the continuous development of a computer-aided tool for sustainability assessment and decision making, with a focus on the coding for the decision making. We also presented our research at the AIChE Annual National Meeting in Phoenix, AZ, in mid-November.
In the 7th quarterly report, we described our initial effort on the development of a computer-aided prototype tool, named the Industrial Sustainability Assessment and Enhancement (ISAE) tool. That report included two screenshots shown in Figs. 1 and 2. In the 8th quarterly report, we reported that we hired an undergraduate senior student, who was guided to help develop a number of modules for sustainability assessment. The tool is currently able to assess a process’ sustainability performance, after a set of sustainability indicators are selected, and plant data are input.


Figure 2 - Sample page to screen for indicator selection in the ISAE tool.
In this period, we continued the tool development, with a focus on the addition of functions for assessing the technology’s capability of improving a process’ sustainability performance. These include (1) the construction of a number of user interfaces for entering technology information, (2) the implementation of a methodology for technology assessment and (3) the implementation of the AHP method based weighting factor determination.
2.1. The ISAE tool development – Interface design for technology information acquisition
The Matlab tool starts with previously submitted data based on the sustainability assessment section. From this point, a tool user (or decision maker) needs to input the anticipated economic, environmental and social sustainability goals into the tool through an input dialog box, as shown in Fig. 3(a). Once the sustainability goals have been entered, the budget of the facility committed for the project is then entered in a dialog box, as shown in Fig. 3(b). The tool then prompts the user to input the number of technologies that are to be evaluated for adoption. Let the total number of individual technologies be N. It is possible that eventually. a plant needs to use multiple technologies for performance improvement. Thus, given N individual technology candidates, the total number of technology sets, each of which can contain one, two or even all N technologies, can be calculated as:
NTech = 2N – 1 (1)
where NTech is the total number of technology sets. The tool then prints out each technology set and asks
the user for input regarding the cost of adopting those technology set(s) (Fig. 3(c)) as well as the percentage improvement data (Fig. 3(d)).

Figure 3 - Tool interface design for the input of: (a) sustainability goal setting, (b) budget limit, (c) technology cost and (d) technology performance.
2.2. Module development for evaluating technology set sustainability performance and the process performance improvement after technology set implementation
With all necessary data and information about the technology sets and the plant’s expectations on minimum performance improvement, the ISAE tool should contain the methodology for technology evaluation. Note that each technology set must be evaluated for its capacity for performance improvement.
The following equations are implemented in the tool:
Ei (P|Tj ) = Ei (P) + ∆Ei (P|Tj ) (2)
Vi (P|Tj ) = Vi (P) + ∆Vi (P|Tj ) (3)
Li (P|Tj ) = Li (P) + ∆Li (P|Tj ) (4)
where Ei (P), Vi (P) and Li (P) are, respectively, the individual indicator-based economic, environmental and social sustainability assessment results of the facility; ΔEi (P|Tj ), ΔVi (P|Tj ) and ΔLi (P|Tj ) are, respectively, the indicator-based performance change of economic, environmental and social sustainability if technology set Tj is adopted; Ei (P|Tj ), Vi (P|Tj ) and Li (P|Tj ) are, respectively, the indicator-based performance of economic, environmental and social sustainability if technology set Tj is implemented in the plant.
Each technology set needs to be evaluated by all sustainability indicators separately. The evaluation results will be combined to derive the categorized sustainability [E(P|Tj ), V(P|Tj ) and L(P|Tj )]
using the following equations:
E(P|Tj ) = aiEi (P|Tj ) (4)
V(P|Tj ) = biVi (P|Tj ) (5)
L(P|Tj ) = ciLi (P|Tj ) (6)
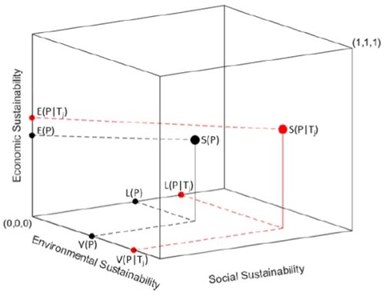
Figure 4 - Design of a module for demonstrating technology-based sustainability performance improvement.
where NE, NV and NL are, respectively, the total number of indicators in the economic, environmental and social sustainability categories; ai, bi and ci are the weighing factors for the corresponding indicators in the economic, environmental and social sustainability categories.
The above equations and the nine-step optimal technical solution method listed in the 10th quarterly report are being coded in the ISAE tool. Figure 4 shows a design of the module in the tool that demonstrates technology based sustainability performance of an electroplating facility before and after implementing a technology set in a sustainability cube. It shows clearly how the process sustainability performance is changed, through comparing the values of E(P) vs. E(P|Tj ), V(P) vs. V(P|Tj ), L(P) vs. L(P|Tj ) and the overall sustainability, i.e., S(P) vs. S(P|Tj ).
3.3. Module for weighting factor determination by the AHP method
In the 6th quarterly report, we presented a case study that contained the values of 11 weighting factors that were associated with 11 sustainability indicators. Those values are summarized from that report in Table 1. Those values were calculated using the AHP method, originally developed by Thomas Saaty in 1980. The method needs to be fully implanted in the ISAE tool.
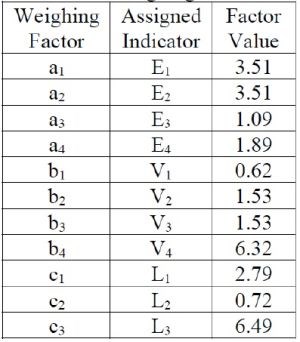
Table 1 – Weighting factors
Here we list all equations that are being coded:
1. Determination of relative importance of sustainability indicators for assessment. The relative importance of each pair of sustainability indicators, e.g., environmental indicators Vi vs. Vj, needs to be determined by the decision maker using Saaty’s AHP method shown in Table 2.

Table 2 – Relative importance for the AHP method.
2. Construction of a relative importance matrix. The relative importance matrix, MAHP, has the following structure. For a categorized sustainability using N indicators, the matrix is:
(8)
where Wi,j is the relative importance between the ith and jth vectors. Note that , Wi,j = 1 if i = j and Wi,j = 1/Wj,i if i ≠ j.
3. Calculation of weighting factors. There are a few steps to follow in the calculation of weighting factor vectors. They are:
(9)
(10)
where MNR is the matrix of the nth roots; NRi is ith root of the products of the factors in the i-th row; and NRT is the sum of all the roots.
(11)
(12)
where αi is the weighing factor of ith indicator.
4. Consistency checking. To confirm the consistency of the calculated weight factor values, the following formulas also need be coded:
(13)
(14)
(15)
(16)
(17)
where AHP is the vector resulting from multiplying the eigenvector to the AHP matrix; λi is the estimate for the eigenvalue from the ith row; λAve is the average of the eigenvalue estimates; CI is the consistency index; CR is the consistency ratio; and η is the Saaty consistency index denominator.
Example. We have tested the calculation for four environmental vectors, V1 to V4, using the formulas listed above. Table 3 shows the relative importance value between each pair of indicators.

Table 3 – Assignment of relative importance of the four environmental indicators.
Using the method, the following matrix and vectors are obtained:
(18)
(19)
The weighting factors, b1 to b4, for environmental indicators V1 to V4, are derived below, which are the same as those shown in Table 1.
(20)
We also obtained the results for the consistency ratio as follows:
(21)
λAve= 4.0725 (22)
CI = 0.024 (23)
CR = 0.027 (24)
Since the consistency ratio value (CR) is below 0.1, the weighting factors shown in Eq. (21) are consistent. The implementation of the AHP-based weighting factor derivation is in general for any type of sustainability problems.
2.4. Presentation activities
In this period, the PI and his students presented three papers as follows, each of which has a focus on sustainable metal finishing:
1. Y. Huang, “Life-Cycle-Based Multiscale Sustainability: Challenges and Opportunities in the Era of Industry 4.0,” plenary speech at the AIChE Annual National Meeting in Phoenix, AZ, Nov. 13-18, 2022.
2. A. Siddiqui, M. Moghadasi and Y. Huang, “Plant-Wide Digital Twinning of Surface Finishing for Sustainable Manufacturing,” Paper No. 86c,, presented at the AIChE Annual National Meeting, Phoenix, AZ, Nov. 13-18, 2022.
3. A. Siddiqui and Y. Huang, “Technology Assessment and Impact Analysis for Life Cycle-Based Sustainability Improvement,” Paper No. 613a, presented at the AIChE Annual National Meeting, Phoenix, AZ, Nov. 13-18, 2022.
3. Plan for the 12th quarter of the project
We will continue to work on the Matlab based tool, ISAE. The tool will be used to conduct more case studies. Besides, we plan to report our research progress on the digital twinning for sustainable metal finishing through developing digital models for characterizing the sustainability performance of electroplating systems.
4. Past project reports
1. Quarter 1 (April-June 2020): Summary: NASF Report in Products Finishing; NASF Surface Technology White Papers, 84 (12), 14 (September 2020); Full paper: http://short.pfonline.com/NASF20Sep1
2. Quarter 2 (July-September 2020): Summary: NASF Report in Products Finishing; NASF Surface Technology White Papers, 85 (3), 13 (December 2020); Full paper: http://short.pfonline.com/NASF20Dec1
3. Quarter 3 (October-December 2020): Summary: NASF Report in Products Finishing; NASF Surface Technology White Papers, 85 (7), 9 (April 2021); Full paper: http://short.pfonline.com/NASF21Apr1.
4. Quarter 4 (January-March 2021): Summary: NASF Report in Products Finishing; NASF Surface Technology White Papers, 85 (11), 13 (August 2021); Full paper: http://short.pfonline.com/NASF21Aug1.
5. Quarter 5 (April-June 2021): Summary: NASF Report in Products Finishing; NASF Surface Technology White Papers, 86 (1), 19 (October 2021); Full paper: http://short.pfonline.com/NASF21Oct2
6. Quarter 6 (July-September 2021): Summary: NASF Report in Products Finishing; NASF Surface Technology White Papers, 86 (4), 19 (January 2022); Full paper: http://short.pfonline.com/NASF22Jan3
7. Quarter 7 (October-December 2021): Summary: NASF Report in Products Finishing; NASF Surface Technology White Papers, 86 (7), 17 (April 2022); Full paper: http://short.pfonline.com/NASF22Apr2
8. Quarter 8 (January-March 2022): Summary: NASF Report in Products Finishing; NASF Surface Technology White Papers, 86 (10), 17 (July 2022); Full paper: http://short.pfonline.com/NASF22Jul2
9. Quarter 9 (April-June 2022): Summary: NASF Report in Products Finishing; NASF Surface Technology White Papers, 87 (1), 17 (October 2022); Full paper: http://short.pfonline.com/NASF22Oct1
10. Quarter 10 (July-September 2022): Summary: NASF Report in Products Finishing; NASF Surface Technology White Papers, 87 (4), 17 (January 2023); Full paper: http://short.pfonline.com/NASF23Jan2
6. About the Principal Investigator

Dr. Yinlun Huang
Dr. Yinlun Huang is a Professor at Wayne State University (Detroit, Michigan) in the Department of Chemical Engineering and Materials Science. He is Director of the Laboratory for Multiscale Complex Systems Science and Engineering, the Chemical Engineering and Materials Science Graduate Programs and the Sustainable Engineering Graduate Certificate Program, in the College of Engineering. He has ably mentored many students, both Graduate and Undergraduate, during his work at Wayne State.
He holds a Bachelor of Science degree (1982) from Zhejiang University (Hangzhou, Zhejiang Province, China), and M.S. (1988) and Ph.D. (1992) degrees from Kansas State University (Manhattan, Kansas). He then joined the University of Texas at Austin as a postdoctoral research fellow (1992). In 1993, he joined Wayne State University as Assistant Professor, eventually becoming Full Professor from 2002 to the present. He has authored or co-authored over 220 publications since 1988, a number of which have been the recipient of awards over the years.
His research interests include multiscale complex systems; sustainability science; integrated material, product and process design and manufacturing; computational multifunctional nano-material development and manufacturing; and multiscale information processing and computational methods.
He has served in many editorial capacities on various journals, as Co-Editor of the ASTM Journal of Smart and Sustainable Manufacturing Systems, Associate Editor of Frontiers in Chemical Engineering, Guest Editor or member of the Editorial Board, including the ACS Sustainable Chemistry and Engineering, Chinese Journal of Chemical Engineering, the Journal of Clean Technologies and Environmental Policy, the Journal of Nano Energy and Power Research. In particular, he was a member of the Editorial Board of the AESF-published Journal of Applied Surface Finishing during the years of its publication (2006-2008).
He has served the AESF and NASF in many capacities, including the AESF Board of Directors during the transition period from the AESF to the NASF. He served as Board of Directors liaison to the AESF Research Board and was a member of the AESF Research and Publications Boards, as well as the Pollution Prevention Committee. With the NASF, he served as a member of the Board of Trustees of the AESF Foundation. He has also been active in the American Chemical Society (ACS) and the American Institute of Chemical Engineers (AIChE).
He was the 2013 Recipient of the NASF William Blum Scientific Achievement Award and delivered the William Blum Memorial Lecture at SUR/FIN 2014 in Cleveland, Ohio. He was elected AIChE Fellow in 2014 and NASF Fellow in 2017. He was a Fulbright Scholar in 2008 and has been a Visiting Professor at many institutions, including the Technical University of Berlin and Tsinghua University in China. His many other awards include the AIChE Research Excellence in Sustainable Engineering Award (2010), AIChE Sustainable Engineering Education Award (2016), the Michigan Green Chemistry Governor’s Award (2009) and several awards for teaching and graduate mentoring from Wayne State University, and Wayne State University’s Charles H. Gershenson Distinguished Faculty Fellow Award. Most recently, he received the AIChE Lawrence K. Cecil Award honoring his contribution in environmental sustainability research, education and leadership (2022).
* Dr. Yinlun Huang, Professor
Dept. of Chemical Engineering and Materials Science
Wayne State University
Detroit, MI 48202
Office: (313) 577-3771
E-mail: yhuang@wayne.edu
RELATED CONTENT
-
Federal Courts Stay Implementation of OSHA COVID-19 Rules
In response to a backlash of litigation, multiple federal courts have blocked implementation of OSHA and other new vaccine mandates for general industry, the healthcare industry and federal contractors.
-
Nanostructure of the Anodic and Nanomaterials Sol-Gel Based Materials Application: Advances in Surface Engineering
Porous alumina can be fabricated electrochemically through anodic oxidation of aluminum. This paper reviews sol-gel chemistry and applications, which also offers unusual nanoporous microstructures. The ability to control pore chemistry at different scales and geometries, provides excellent bioactivity, enabling the entrapment of biologically active molecules and their controllable release for therapeutic and medical applications.
-
Hybrid Sol-Gel Coatings in Surface Engineering
A look at the use of modified sol-gel polymer films and hybrid system coatings, as well as the methodologies for evaluating the mechanical properties of the coatings.


