

.JPG;width=70;height=70;mode=crop)
Share
Most finishers state that they believe parts cleaning helps optimize quality, productivity and profitability. Yet, despite the fairly uniform beliefs and claims from shops about their cleaning processes, variances in quality yield persist. Hubbard-Hall commissioned an objective third party, Gardner Intelligence, to conduct a custom survey among job and captive shops, and analysis of Products Finishing Top Shops benchmarking survey results for data-based insights to help understand attitudes and practices concerning cleaning.
The results of the survey indicate that attitudes and beliefs about cleaning are essentially the same across facilities regardless of their quality yield. So, what is driving the difference in quality yield for finishers? How do cleaning and pretreatment processes alter quality yield? And, what is the relationship between quality yield and the bottom line?
Featured Content


Analysis of Data
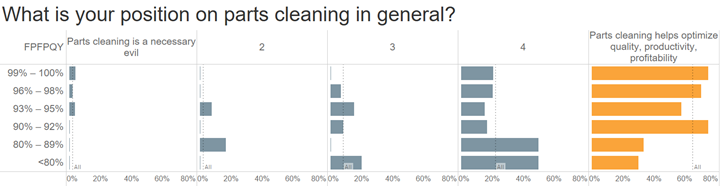
Regardless of quality yield, 67% of finishers state that they believe parts cleaning helps optimize quality, productivity and profitability. And, the vast majority of the remaining shops are close to this view as well. Similarly, nearly 67% of respondents, regardless of quality yield, claim to have a strict, standardized, regular cleaning practice. Most of the remaining respondents claim to have a defined cleaning practice that they apply most of the time.
So, it would seem there is very little difference in the general position on parts cleaning based on quality yield. It is therefore important to note that poor quality parts are not a result of individuals thinking, or even more claiming, that cleaning is not important.
However, there is a notable difference in the position on parts cleaning when finished-product, first-pass quality yield is more than 90% versus less than 90%.
While there isn’t necessarily a linear correlation with quality yield, it is evident that cleaning practices are quite different for finishers with the highest quality yield versus those with the lowest quality yield.
Nearly 80% of shops with a quality yield more than 99% state that they have a strict, standardized and regular cleaning practice. However, only 11% of shops with a quality yield below 80% also claim this.
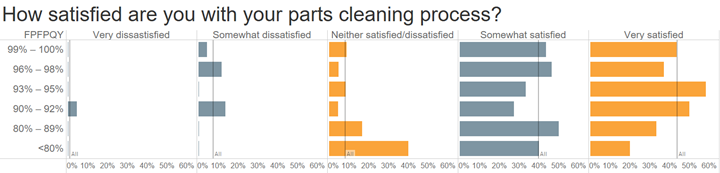
The survey responses also show that nearly 85% of finishers are fairly satisfied with their cleaning process. Shops with a quality yield greater than 90% are much more likely to be very satisfied with their cleaning process. Meanwhile, shops with a quality yield less than 90% are much more likely to be neither satisfied nor dissatisfied with their cleaning process.
Despite the fairly uniform beliefs and claims from shops regarding cleaning processes, there are some important differences in the stated reasons for poor quality.
Before we get to the differences, our research indicated that labor is the most cited reason for poor quality regardless of quality yield. Basically, labor is the scapegoat of poor quality for finishers. Also, there is no clear trend for process, equipment or related factors as the reason for not meeting quality standards. Such considerations maintain a relatively constant percent of the problem across quality yield.
The research indicates that there is a fairly clear linear relationship for both poor raw part quality and poor pretreating/cleaning with quality yield.
The research did indicate that there is a fairly clear linear relationship for both poor raw part quality and poor pretreating/cleaning with quality yield. Poor raw part quality receives more blame for not meeting quality standards as the quality yield goes up. The reverse is true for poor pretreating/cleaning – as quality yield goes down, poor pretreating/cleaning is assigned more blame for not meeting quality standards.

So, despite the similar stated claims and beliefs about cleaning regardless of quality yield, shops with lower quality yields do realize that poor pretreating/cleaning is more of a problem for them. In essence, as quality yield goes down, the real culprit is poor pretreating/cleaning.
Based on more than 1,300 responses to the PF Top Shops benchmarking surveys for coating and plating, Gardner Intelligence identified that there is a correlation between quality yield and profit margin. As quality yield increases, profit margin increases. For every two-percentage-point increase in quality yield, there is about a one-percentage-point increase in profit margin. Because this is an increase in net income, the additional expense of achieving the higher quality yield is already factored into the equation.
Since the research shows that the controllable variable in quality yield in finishing shops is the cleaning and pretreatment process, finishers can achieve improved quality yield and additional profit through better pretreatment/cleaning processes despite the claims that most finishers have at least a well-defined, if not strict and standardized, process that they are satisfied with.
Process control and improvement
So, what does a better pretreatment/cleaning process look like?
First, finishers need to ensure that they are spending an adequate amount on pretreatment chemicals as a percent of revenue. The survey results show that to achieve a quality yield of 93% or higher, the median finisher spends 1% of revenue on pretreatment chemicals. So, for every $1 million in revenue, that is $10,000 spent on pretreatment chemicals. Some finishers will spend a higher or lower percentage of revenue depending on the quality standards required and the types of contaminants that need to be removed.
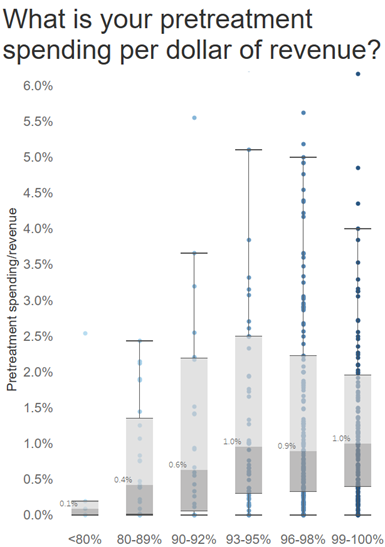
However, there is some evidence that spending more on pretreatment chemicals per dollar of revenue doesn’t automatically lead to higher quality yield. The top quartile of finishers with 93-95% quality yield spends at least 2.5% of revenue on pretreatment chemicals. Yet, the top quartile of spending goes down as the quality yield goes higher than 95%. In other words, shops with 93-95% yield may spend more than those whose yield exceeds 95%. This indicates that process control becomes as or more important than increased spending as quality yield increases above 95%. Further, this means that there are differences in actual practices even though finishers claim similar beliefs and practices about cleaning and pretreatment.
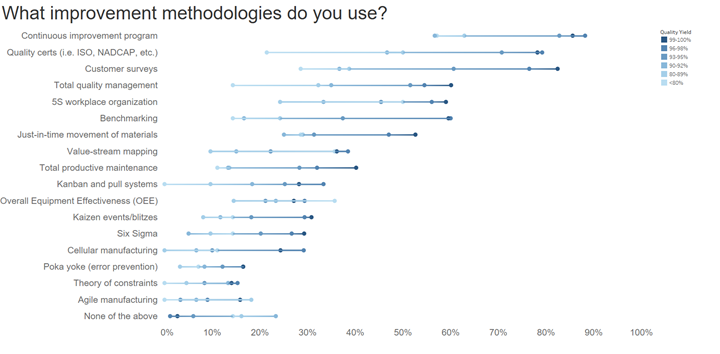
Improvement methodologies are the broadest practice (they apply to cleaning/pretreatment but not exclusively so) to improve quality yield. Finishers with a 99-100% quality yield are generally more likely to use any of the improvement methodologies available when compared with finishers with a lower quality yield. The improvement methodologies most directly related to cleaning and pretreatment and likely having the most impact on quality yield and profit margin are a continuous improvement program, quality certifications, total quality management, 5S workplace organization and benchmarking. These improvement methodologies are an essential part of having a strict, standardized, regular cleaning process and supporting the belief that cleaning/pretreatment helps optimize quality, productivity, and profitability. One should also note that 15% to almost 25% of shops with a quality yield less than 93% do not use a single improvement methodology.
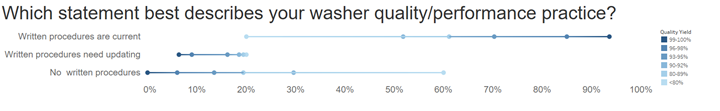
While the vast majority of finishers, regardless of quality yield, claim to have a defined cleaning process, there is a dramatic difference based on quality yield in the percent of finishers that have written current procedures for washer quality and performance. Close to 95% of finishers with a quality yield greater than 99% have written up-to-date washer procedures — that number drops precipitously as yield declines.
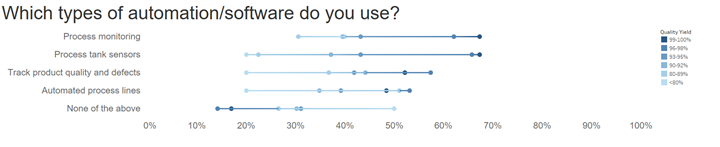
Automation can also help implement an improvement methodology and track compliance with written plans. Shops with a quality yield greater than 96% are far more likely to use process monitoring and process tank sensors.
Finally, this brings us to another important aspect of parts cleaning – testing. The median shop with a quality yield greater than 99% spends 30 hours per week on analytical testing (admittedly, not all of this is spent on cleaning processes).
In Conclusion
The ultimate goal for finishers, of course, is to have cleaning and pretreatment add to the bottom line. Finding the sweet spot in what you spend on chemicals and detailing your process in writing and keeping it up-to-date are key ways to contribute to that goal. Based on the findings of this study, it is recommended that finishers spend 1% of revenue on pretreatment chemicals. This will vary depending on the process and contaminants to be removed.
It is also recommended that finishers practice an improvement methodology that includes writing down and continuously monitoring cleaning processes. Software and automation can aid in this methodology and regular testing of pretreatment baths is recommended.
A white paper outlining these findings is available at The Case for Cleaning. The white paper contains additional data breakouts and deeper recommendations around cleaning and process control and monitoring.
RELATED CONTENT
-
Cleaning Prior to PVD/CVD Coating
Determining the cleanliness and chemical de-coating of PVD/CVD layers.
-
VDA 19 and its Impact on European Manufacturing and Cleaning
The German Association of the Automotive Industry’s VDA Volume 19 is the first comprehensive standardization document for characterizing the cleanliness of products within the automotive industry’s quality chain.
-
Top Reasons to Switch to a Better Cleaning Fluid
Venesia Hurtubise from MicroCare says switching to the new modern cleaning fluids will have a positive impact on your cleaning process.


