
Tin-Zinc Alloy Electroplating and Its Corrosion Behavior
An NASF/AESF Foundation Research Program Retrospective
#nasf #surfin

Share
Tin-Zinc Alloy Electroplating and Its Corrosion Behavior
A NASF/AESF Foundation Research Program Retrospective
Featured Content


by
K. Wang, H.W. Pickering and K.G. Weil
The Pennsylvania State University
Department of Materials Science and Engineering
University Park, Pennsylvania, USA
Editor’s Note: One of the important goals of the NASF/AESF Foundation Research program is to give Graduate Students the opportunity to hone their writing and presentation skills in quarterly progress reports and at our SUR/FIN conferences. Originally published as K. Wang, H.W. Pickering and K.G. Weil, Proceedings AESF SUR/FIN 2000, 12-17 (2000), this paper was delivered in Research Session A, at AESF SUR/FIN 2000 in Chicago, Illinois. A retrospective of AESF Project R-99 at the Pennsylvania State University, the work, methodology and results discussed here remain significant. A printable version of this paper is available by clicking HERE.
ABSTRACT
A 70% Sn - 30% Zn alloy is deposited from a neutral non-cyanide bath. Scanning electron microscopy (SEM) and energy dispersive X-ray spectroscopy (EDS) show that it is composed of Sn and Zn phases. By use of an electrochemical quartz crystal microbalance (EQCM), the plating current efficiency is calculated. When the plated sample is exposed to a 0.5M Na2SO4 (pH=3.6) solution at open circuit potential (OCP), the EQCM measures the corrosion rate. The open circuit potential shows that the Zn dissolution reaction is the major reaction occurring at OCP. A linear potential scanning experiment shows that the anodic polarization current of this alloy is rather small in a wide range of potential until it reaches the anodic dissolution potential of pure Sn in the same solution.
1. Introduction
It has always been of interest for the metal finishing industry to develop high performance, sacrificial plated coatings. Zinc coatings have been employed for years to supply protection to ferrous base metals. When combined with tin, nickel, cobalt or iron, the coatings achieve performances that exceed that of zinc. Sn-Zn alloy coatings have several attractive properties. First of all, they provide good protection for a steel matrix. At the same time, these alloys have good frictional properties, wear resistance and excellent solderability. They are also ductile and have low electrical contact resistance. Because of such advantages, Sn-Zn alloy coatings are regarded as ideal replacements of plated cadmium coatings, which have been popular for many years, but are toxic and carcinogenic.1,2 However, in the past several decades, the development of Sn-Zn electroplating was rather slow because conventional Sn-Zn plating baths were also toxic and difficult to maintain and control.3,4,5 Currently, with an improvement in plating practice, plated Sn-Zn coatings are receiving more and more applications. Sn-Zn coatings have been used on the chassis of electronic
apparatus and on automotive parts such as fuel and brake line components. It has been reported that a tin-zinc alloy with a composition of 70-80% Sn and 20-30% Zn has the best comprehensive properties.6,7 In the present study, we electroplated a 70% Sn - 30% Zn alloy on a steel substrate from a neutral and non-cyanide bath,8 and investigated the details of the corrosion mechanism of the deposit in a pH3.6 Na2SO4 solution.
2. Experimental
The substrates used in this investigation were carbon steel coupons cut from 0.07 cm (0.028 in.) thick, cold rolled and annealed steel sheets. A copper wire was fastened to the back sides of the steel plates by soldering. An insulating lacquer was applied so that only the 1 cm × 1 cm front surface was exposed to the solution. The Sn-Zn alloy plating bath is a newly developed neutral non-cyanide solution. Prior to the deposition, the steel plates were polished with #800 SiC polishing paper and degreased with acetone and rinsed with double distilled water. After plating, the samples were again rinsed with double distilled water and dried in air.
The neutral bath formulation can be seen from Table 1. The plating operation was performed at room temperature.
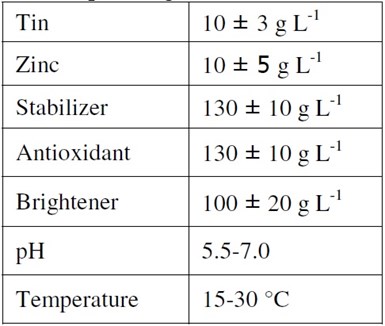
Table 1 - Neutral bath formulation and operating conditions.
Corrosion experiments were performed at room temperature in a 0.1M Na2SO4 solution with the pH value adjusted to 3.6 by adding sulfuric acid. Voltammetric curves were taken with a potentiostat connected to a personal computer. A saturated calomel electrode (SCE) was used as the reference and a carbon rod as the counter electrode. All of these experiments were done in deaerated solutions.
An electrochemical quartz crystal microbalance (EQCM) was used for in-situ measurement of the plating rates and corrosion rates. The operation of the EQCM is based on the vibration feature of a quartz crystal. Over a wide mass (m) range, the relationship between the resonant frequency f of a quartz crystal and the mass that is rigidly attached to the crystal surface is linear:
Δf = −Κ Δm (1)
where Κ is a positive constant. Thus, when measuring changes in the vibration frequency of the crystal, the EQCM monitor automatically converts them into the mass changes that the sample undergoes. The sensitivity of the EQCM can be 1 ng/cm2 (6.5 ng/in.2), which makes it an ideal instrument to study electroplating and corrosion.9
For EQCM experiments, a 26 mm (1.0 in.) diameter, 5MHz quartz crystal was used. The plating substrate is a gold film coated on the crystal surface. The exposed area of the gold film is 1.4 cm2 (0.22 in.2). A personal computer with data acquisition software was used to record the mass change.
The surface morphology and composition of the deposit were observed by scanning electron microscopy (SEM) and by energy dispersive X-ray spectroscopy (EDS).
3. Results and discussion
The composition of the Sn-Zn deposit will change with plating current density. In order to determine the composition of the alloy deposit, we first dissolved the whole steel/deposit sample in nitric acid, and then used inductively coupled plasma mass spectroscopy (ICP) to measure the Sn/Zn weight ratio in the solution. Figure 1 shows the relationship between the plating current density and the deposit composition. Within a certain current density range, the Zn content in the deposit increases with the plating current density. We were mostly interested in 70% Sn -30% Zn alloy, so we applied 5 mA/cm2 (32 mA/in.2) as the plating current density. The deposit layer morphology is shown in Fig. 2.

Figure 1 - Composition change with the plating current density.
Figure 2 - Scanning electron micrograph (3000x) of the Sn-Zn deposit.
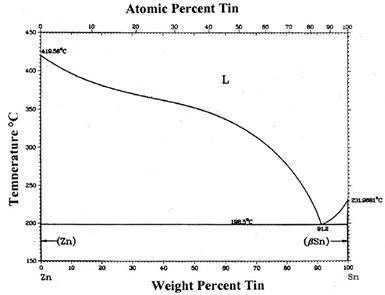
Figure 3 - Sn-Zn phase diagram.
According to the Sn-Zn phase diagram (Fig. 3), Sn and Zn have very low mutual solubilities. They also do not form any compound at room temperature. The X-ray diffraction pattern of the deposit layer confirmed that the coating is composed of the terminal Sn and Zn phases. Under 5000x magnification, the EDS spot analysis cannot find any composition difference at different surface locations, which means the tin and zinc phases are finely mixed together.
By use of the EQCM, the mass increase of the alloy deposit with time during plating was measured and is shown in Fig. 4. The straight line indicates that the deposition rate is rather stable. The calculation of the plating current efficiency, η, from Faraday's law is shown as follows:
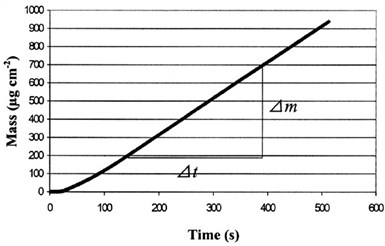
Figure 4 - Mass change of the alloy deposit with time during electroplating.
Q = n𝕱N
i = n𝕱Δm / MΔt
η = i / itotal
Δm/Δt = 1.90 µg/cm2-sec
M = 0.7 MSn + 0.3 MZn = 102.9 g/mol
i = 3.57 mA/cm2
itotal = 5 mA/cm2
η = 71%
where Q is the amount of charge released by metal ions during plating; n is the valence of the metal ions; 𝕱 is Faraday's constant; N is the number of moles of metal atoms deposited; Δm is the mass change; M is the molar mass; i is the effective current density, i.e., the current density consumed by metal deposition and itotal is the total current density applied.
After electroplating, the sample was immersed in a 0.1M Na2SO4 solution of pH 3.6 and the open circuit potential (OCP) was measured (Fig. 5). For the first couple of hours, the OCP of the sample was very stable, between -1.09 V and -1.11 V (SCE) for different samples. To make comparisons, the open circuit potentials of different metals in the same solution were measured. These are shown in Table 2.
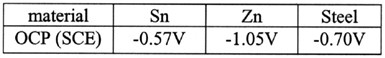
Table 2 - Open circuit potential of different metals in 0.1M Na2SO4 (pH=3.6) solution.
From Table 2, we can see that the open circuit potential of Sn-Zn alloy is very close to the OCP of pure Zn. This means the Zn dissolution reaction dominates the corrosion mechanism of the alloys. Zn is acting as a sacrificial anode, keeping the potential of the sample at a negative value, thus providing cathodic protection to the tin phase and the steel matrix.
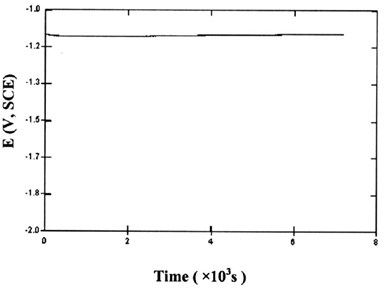
Figure 5 - Open circuit potential of Sn-Zn deposit vs. time in 0.1M Na2SO4 (pH=3.6) solution.
By use of the EQCM, we measured the mass loss of the deposit with time during the corrosion process at OCP (Fig. 6). This mass loss is caused by the corrosion of the deposit, i.e., the dissolution of zinc. Thus, the slope of the curve shows the corrosion rate of the deposit. After a short period (< 1 hour) of fast dissolution, the mass loss rate dropped and reached a steady state with a mass loss rate of about 2.42 x 10⁻³ μg/cm2-sec (1.56 x 10⁻² μg/in.2-sec).
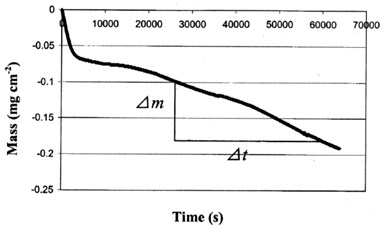
Figure 6 - The mass change with time at the surface of the EQCM crystal at OCP.
To estimate the steady state corrosion current density at open circuit potential, we assumed that the dissolution of Sn at OCP is negligible, which is confirmed by the corrosive solution ICP analysis below. Also, from Faraday's law, we calculated the corrosion current density:
Δm/Δt = 2.42 µg/cm2-sec
M = MZn = 65.77 g/mol
i = n𝕱Δm / MΔt - 7.1 µA/cm2 (45.8 µA/in.2)
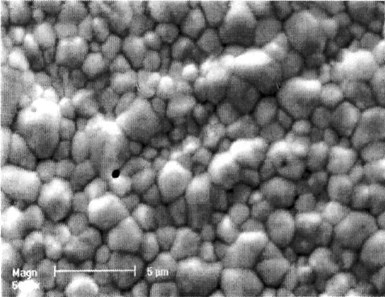
Figure 7 - SEM Image (3000x) of the deposit after 24 hr corrosion at OCP in 0.1M Na2SO4(pH=3.6) solution
To measure the protective capability of the deposit layer, we left the plated sample in 300 mL of the above corrosive solution for 24 hours. After that, a small amount of potassium ferric cyanide was added to the solution. No observable color change occurred, which means that Fe dissolution did not occur. Further ICP analysis of the solution showed that the Zn, Sn and Fe concentrations in the solution were 1.9, <0.1 and <0.1 ppm, respectively. Figure 7 shows the morphology of the deposit after 24 hours of corrosion.
Figure 8 - (a) Polarization curve of the Sn-Zn plated layer in 0.1M Na2SO4 (pH=3.6) solution; (b) comparison with the polarization curves of other metals.
Fig. 8 shows the polarization curves of the different metals in the same corrosive solution. As the potential increases from the alloy's OCP, the anodic current density stays very small until the potential causes dissolution of the Sn. The current density then increases steeply with time. This means that, although Zn gives cathodic protection to the steel matrix at the open circuit potential, Sn contributes its barrier property for added protection in corrosive environments.
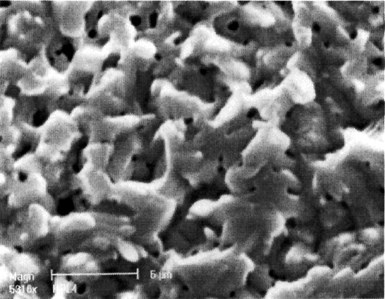
Figure 9 - SEM image (3000x) of Sn-Zn deposit after a potential scan from OCP to -0.4 VSCE.
Figure 9 shows the surface layer structure of the deposit after the polarization experiment in Fig. 8. EDX shows that the composition of this remaining deposit is now almost pure Sn.
4. Conclusions
It could be shown that Sn-Zn alloys, electroplated from a neutral bath, consist of Sn and Zn phases, which are finely mixed together. By use of EQCM, we can estimate the electroplating current efficiency and the corrosion current density, which are 71% and 7.1 μA/cm2 (45.8 μA/in.2), respectively. Zn dissolution is the major corrosion reaction at the open circuit potential in pH 3.6 Na2SO4 solution, thus providing cathodic protection to the steel matrix. Polarization experiments show that the electroplated Sn-Zn alloy also features the barrier property of Sn, which enhances the durability of the plating layer and improves its corrosion resistance in severely corrosive environments.
5. Acknowledgements
This work was supported by the American Electroplaters and Surface Finishers Society and the National Science Foundation (Grant No. DMR-9612303). Thanks are due to Bethlehem Steel Corporation (C.R. Shastry), who provided the samples, and Dipsol Gumm Ventures, who provided the plating solutions.
6. References
1. S.J. Blunden, Advanced Materials & Processes, 137, 37 (1991).
2. E. Budman and D. Stevens, Trans. Inst. Met. Fin., 76, B34 (1998).
3. A.E. Davis, R.M. Angles and J.W. Cuthbertson, Trans. Inst. Met. Fin., 29, 227 (1953).
4. N. Dohi and K. Obata, J. Met. Fin. Soc. Japan, 24, 674 (1973).
5. O.A. Ashiru and J. Shirokoff, Applied Surface Science, 103, 159 (1996).
6. R.M. Angles and R. Kerr, Engineering, 161, 289 (1946).
7. W.H. Ailor, Atmospheric Corrosion, J. Wiley & Sons, 1982; p. 520.
8. Technical Bulletin, Dipsol Gumm Ventures Co., 1996.
9. M. Benje, M. Eiermann, U. Pittermann and K.G. Weil, Ber. Bunsenges. Phys. Chern., 90, 435 (1986).
7. About the authors (as of 2000)
Kai Wang is a Ph. D. Graduate Student in the Materials Science and Engineering Department, College of Earth and Mineral Sciences at The Pennsylvania State University.
Dr. Howard W. Pickering is Distinguished Professor in the Materials Science and Engineering Department, College of Earth and Mineral Sciences at The Pennsylvania State University.
Dr. Konrad G. Weil retired from the Technical Hochschule Darmstadt, Germany and is a scholar in the Materials Science and Engineering Department, College of Earth and Mineral Sciences at The Pennsylvania State University.
RELATED CONTENT
-
Cyanide-Free Electroplating of Cu-Sn Alloys
This paper is a peer-reviewed and edited version of a presentation delivered at NASF SUR/FIN 2012 in Las Vegas, Nev., on June 13, 2012.
-
Electroplated Tin-Nickel Coatings as a Replacement for Nickel to Eliminate Nickel Dermatitis
This paper is a peer-reviewed and edited version of a paper delivered at NASF SUR/FIN 2013 in Rosemont, Ill., on June 12, 2013.
-
Federal Courts Stay Implementation of OSHA COVID-19 Rules
In response to a backlash of litigation, multiple federal courts have blocked implementation of OSHA and other new vaccine mandates for general industry, the healthcare industry and federal contractors.


