Solvent Substitution Strategies for Finishers
The cleaning and coatings industrial sectors have been affected by restrictions on ozone-depleting (OD) solvents, hazardous air pollutants (HAPs), smog producing volatile organic carbon (VOC), and solvents with a high global warming potential (GWP).
Theory
Solvent-Soil Interactions
Featured Content
The cleaning solvent, the surface, and the soil must spontaneously “like each other”. For the soil and solvent a negative Gibbs energy of mixing (DGmix) indicates that the substances “like” each other enough to mix spontaneously.
The DGmix can be written (Eq. 1) in terms of the enthalpy of mixing (DHmix), the entropy of mixing (DSmix), and the temperature of the system (T).
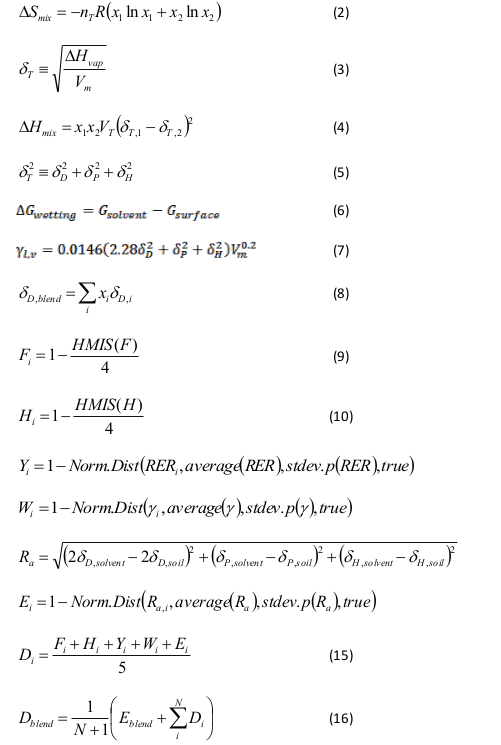
The entropy of mixing depends upon the volume fractions (xi = vi / VT) of each of the components (Eq. 2) as well as the total number of moles of molecules (nT ) and the gas constant (R) 8.3145 J mol-1 K-1. In Eq. 2, all the volume fractions are less than one, which means it is always entropically favorable to form mixtures.
If substances do not spontaneously mix, it is due to the enthalpy of mixing. Hildebrand and Scott [ 4] coined the term “solubility parameter” (dT in Eq. 3) defined as the square root of the enthalpy of vaporization (DHvap) for a solvent divided by its molar volume (Vm). It is expressed in either (J/mL)1/2 or the numerically equivalent MPa1/2.
Each substance will have a Hildebrand solubility parameter and these may be compared to yield the enthalpy of mixing via Eq. 4.
Therefore, one may predict that mixing will occur if two substances have similar Hildebrand solubility parameters. Hansen [ 5] refined the solubility parameter approach to account for three types of intermolecular forces – dispersion (dD), polarity (dP), and hydrogen-bonding (dH) – thus creating the Hansen solubility parameters (HSPs). They are related to dT via the geometric mean (Eq. 5).
This has proven to be a very useful system for understanding the intermolecular attractions because the HSPs of solvents and soils can be plotted in a three-dimensional Hansen solubility coordinate space (Fig. 1).
The solvent abbreviations in Fig. 1 represent Asahiklin (AK225) from Asahi Glass Co. Ltd., HFE-7100 (HFE71), HFE-7500 (HFE75), HFE-7300 (HFE73) from 3M Company, Solstice LBA (Sols) from Honeywell International Inc., the cyclic dimethylsiloxane tetramer (D4) from Dow Corning, d-limonene (dLIM), toluene (TOL), perchloroethene (Perc), n-propylbromide (nPB), isopropyl alcohol (IPA), acetone (ACE), and trans-dichloroethene (tDCE). The soil in this example is a high-vacuum grease (HVG). The color coding of the data points follows the coloration of the dP (red), dH (green), and dD (blue) axes. Similarly colored solvents and soils interact strongly – like dissolves like.
The HSPs of the solvents were obtained from the HSPiP software. [ 6] Determining the HSPs of the soil may be as easy as an Internet search if the soil is a commercial oil or grease. But sometimes, a small series of solvent exposure lab tests are required as detailed in Hansen’s handbook [ 5] and online [ 6]. Once the soil HSPs are known, solvent substitution and blend prediction may begin.
Solvent-Surface Interactions
Spontaneous wetting of a surface by a solvent is indicated by a negative change in free energy per unit area (DGwetting).
Where Gsurface is the initial surface energy of the surface, and Gsolvent is the surface energy (liquid-vapor surface tension, gl,v) of the solvent. If the solvent has a lower surface energy than the substrate, then it will spontaneously wet the surface. The determination of the surface energy of a solid substrate is reviewed elsewhere. [ 7, 8] The surface tension is easily found in tables for pure solvents. For blends, a simple measurement may be made using a surface tensiometer. [ 9] If measurement is impractical, Eq. 7 from Hansen’s eBook [ 6] may be used to estimate the solvent surface tension.
Solvent Blend Evaluation, Prediction, and Selection
The HSPs of a blend are simply the volume-fraction-weighted sums of the HSPs of the blend components (Eq. 8).
In Eq. 8, the dD,i represents the dispersion Hansen solubility parameter for the i-th component of the blend. The same treatment is used for the dP,blend and dH,blend parameters. One may also approximate the molar volume of the blend by a weighted average of the molar volumes of the components.
Essentially, binary blends are represented in DPH-space by a straight line between the two components; a three-component blend forms a triangle; and a four-component blend forms a 4-sided polygon. If the soil HSPs lie close to the triangle or within the polygon, then these blend components will produce a promising blend. Software is available that will search for the optimum blend recipe targeting the HSPs of a given soil.[ 10, 6]
Desirability Rankings
One must determine an overall desirability function for ranking the many possible blend recipes. This article illustrates the use of five common criteria – Flammability (F), Toxicity (H), Volatility (Y), Surface Tension (W), and Effectiveness (E). For the purposes of optimization, each criterion is transformed into a 0 (bad) to 1 (good) scale.
The flammability term (F) uses the Hazardous Material Identification System (HMIS) [ 11] on the MSDS that ranks flammability from 0 (low) to 4 (high), and Eq. 9 converts this to the necessary 0 to 1 range.
A similar treatment is used for the toxicity rating (H) from the HMIS(H) term as seen in Eq. 10.
The volatility term (Y) is based upon the solvent evaporation rate (RER) relative to n-butylacetate. [ 6] Because the magnitude of RER may vary from near-zero to several thousand, the inverted percentile rank of the RER relative to the full set of solvents under consideration is used. In English, the most volatile solvent will have a near-zero rank and the least volatile solvent will have a rank near one. Note: the non-inverted percentile rank may be used if fast-evaporating solvents are desired. This percentile rank is based upon a normal distribution function which is standard in Excel (Eq. 11).
A similar treatment is used to rank the surface tension of the candidate solvents from high (0) to low (1) so that good wetting properties (Wi) may be favored in the overall evaluation.
The predicted effectiveness of the solvent against a particular soil is captured in the Hansen distance term (Ra, Eq. 13). [ 5]
The inverted percentile rank (Eq. 14) is used on Ra to transform small Ra to values near 1 and large Ra to values near 0.
The individual rankings are averaged (Eq. 15) to give a desirability rating for each solvent.
For blended solvents, the desirability ratings (Di) of the blend components are averaged along with the blend effectiveness rating (Eblend) to determine the overall blend desirability rating (Eq. 16).
The N in Eq. 16 represents the number of blend components. The effectiveness of the blend (Eblend) is calculated using the Hansen distance of the blend to the soil using Eq. 14.
Example
To illustrate this process, a silicone-based high vacuum grease (HVG) was chosen as the soil. The Hansen solubility parameters were determined to be (16.0, 2.3, 1.4) using the solvent interaction method. [ 6] The Hansen distances from 14 common solvents to HVG are shown in Table 1 as well as the desirability ratings of each solvent against HVG.
Table 1: A selection of solvents ranked according to their desirability for cleaning a high-vacuum silicone grease with the (dD, dP, and dH) values of (16.0, 2.3, 1.4). The components of the desirability rating are color-coded green and red for good and bad, respectively.
|
Solvent |
dD |
dP |
dH |
Vm |
HMIS(F) |
HMIS(H) |
RER |
gl,v |
Ra |
Fi |
Hi |
Yi |
Wi |
Ei |
Di |
|
HFE71 |
13.7 |
2.2 |
1.0 |
164.5 |
1 |
0 |
1501 |
18 |
4.6 |
0.75 |
1.00 |
0.77 |
0.88 |
0.73 |
0.83 |
|
Sols |
15.1 |
4.1 |
2.8 |
97.4 |
0 |
2 |
3933 |
20 |
2.9 |
1.00 |
0.50 |
1.00 |
0.77 |
0.84 |
0.82 |
|
AK225 |
14.1 |
3.2 |
1.0 |
147.9 |
1 |
1 |
1415 |
18 |
3.9 |
0.75 |
0.75 |
0.74 |
0.85 |
0.78 |
0.77 |
|
HFE73 |
13.8 |
0.2 |
0.0 |
217.4 |
1 |
1 |
499 |
19 |
5.1 |
0.75 |
0.75 |
0.40 |
0.84 |
0.69 |
0.68 |
|
HFE75 |
13.3 |
2.0 |
1.0 |
215.0 |
1 |
1 |
151 |
17 |
5.4 |
0.75 |
0.75 |
0.27 |
0.89 |
0.66 |
0.66 |
|
D4 |
12.8 |
1.3 |
1.0 |
312.4 |
2 |
0 |
15 |
17 |
6.5 |
0.50 |
1.00 |
0.23 |
0.89 |
0.56 |
0.64 |
|
nPB |
16.4 |
7.9 |
4.8 |
91.4 |
0 |
2 |
582 |
25 |
6.6 |
1.00 |
0.50 |
0.43 |
0.37 |
0.56 |
0.57 |
|
tDCE |
16.7 |
7.8 |
3.3 |
77.6 |
3 |
2 |
1186 |
25 |
6.0 |
0.25 |
0.50 |
0.66 |
0.41 |
0.61 |
0.49 |
|
Perc |
18.3 |
5.7 |
0.0 |
102.8 |
0 |
3 |
87 |
29 |
5.9 |
1.00 |
0.25 |
0.25 |
0.12 |
0.62 |
0.45 |
|
ACE |
15.5 |
10.4 |
7.0 |
73.8 |
3 |
1 |
786 |
24 |
9.9 |
0.25 |
0.75 |
0.51 |
0.43 |
0.26 |
0.44 |
|
dLIM |
17.2 |
1.8 |
4.3 |
162.9 |
2 |
2 |
12 |
28 |
3.8 |
0.50 |
0.50 |
0.23 |
0.17 |
0.79 |
0.44 |
|
TOL |
18.0 |
1.4 |
2.0 |
106.6 |
3 |
2 |
139 |
28 |
4.1 |
0.25 |
0.50 |
0.27 |
0.20 |
0.76 |
0.40 |
|
IPA |
15.8 |
6.1 |
16.4 |
92.0 |
3 |
1 |
153 |
32 |
15.4 |
0.25 |
0.75 |
0.27 |
0.05 |
0.03 |
0.27 |
|
ACN |
15.3 |
18.0 |
6.1 |
52.9 |
3 |
2 |
211 |
29 |
16.4 |
0.25 |
0.50 |
0.29 |
0.14 |
0.01 |
0.24 |
One can see in Table 1 that both HFE71 and Sols are comparable replacements for AK225 for this particular soil. The HFE73 solvent is potentially lacking in effectiveness for this soil. The effectiveness of d-limonene is good, but dLIM suffers in all other categories. This is a good example of balancing risk and requirements in solvent substitution decisions.
All 91 pairwise combinations of these solvents were computed and Table 2 shows the optimized blend recipes for the top 16 binary blends sorted by desirability.
Table 2: A selection of binary blend recipes that have been optimized to target the HVG soil. The blends are sorted by the overall desirability rating (Dblend).
|
x1 |
Solvent1 |
x2 |
Solvent2 |
Ra |
Eblend |
D1 |
D2 |
Dblend |
|
0.06 |
HFE71 |
0.94 |
Sols |
2.88 |
0.62 |
0.83 |
0.82 |
0.76 |
|
0.21 |
HFE73 |
0.79 |
Sols |
2.66 |
0.66 |
0.68 |
0.82 |
0.72 |
|
0.47 |
HFE71 |
0.53 |
TOL |
0.54 |
0.94 |
0.83 |
0.40 |
0.72 |
|
0.56 |
dLIM |
0.44 |
HFE71 |
1.61 |
0.83 |
0.44 |
0.83 |
0.70 |
|
0.57 |
HFE71 |
0.43 |
Perc |
1.76 |
0.81 |
0.83 |
0.45 |
0.70 |
|
0.61 |
Sols |
0.39 |
TOL |
1.37 |
0.86 |
0.82 |
0.40 |
0.69 |
|
0.38 |
dLIM |
0.62 |
Sols |
2.16 |
0.75 |
0.44 |
0.82 |
0.67 |
|
0.24 |
Perc |
0.76 |
Sols |
2.30 |
0.73 |
0.45 |
0.82 |
0.67 |
|
0.43 |
HFE75 |
0.57 |
TOL |
0.67 |
0.93 |
0.66 |
0.40 |
0.66 |
|
0.54 |
HFE73 |
0.46 |
Perc |
1.51 |
0.85 |
0.68 |
0.45 |
0.66 |
|
0.59 |
dLIM |
0.41 |
HFE73 |
1.65 |
0.83 |
0.44 |
0.68 |
0.65 |
|
0.39 |
D4 |
0.61 |
TOL |
0.97 |
0.90 |
0.64 |
0.40 |
0.65 |
|
0.58 |
HFE73 |
0.42 |
nPB |
2.55 |
0.68 |
0.68 |
0.57 |
0.65 |
|
0.44 |
HFE73 |
0.56 |
TOL |
1.50 |
0.85 |
0.68 |
0.40 |
0.64 |
|
0.52 |
HFE75 |
0.48 |
Perc |
1.83 |
0.80 |
0.66 |
0.45 |
0.64 |
|
0.61 |
dLIM |
0.39 |
HFE75 |
1.76 |
0.81 |
0.44 |
0.66 |
0.64 |
This systematic process should guide the reader towards the most promising solvent replacement candidates, and these candidates should be prepared for miscibility testing [ 12, 13, 14], and cleaning effectiveness testing [ 15].
Acknowledgement
This work has been developed over the years with funding from SHSU, US-DOE, NASA-WSTF, and the Welch Foundation. Charles Hansen, Steven Abbott, Hiroshi Yamamoto, Karl Kuklenz, and James Huskey are acknowledged.
Dr. Williams Associate Professor in the Chemistry Department at Sam Houston State University, Huntsville TX.has over a decade of experience in cleaning verification, solvent substitution, and blend prediction in addition to his work in spectroscopy (Raman, IR, and UVVIS) and computational chemistry (color prediction and spectroscopic modeling). He can be reached at williams@shsu.edu or http://www.shsu.edu/~chm_dlw
References
|
1. |
United States Environmental Protection Agency. Significant New Alternatives Policy (SNAP) Program. http://www.epa.gov/ozone/snap/ (accessed June 12, 2013). |
|
2. |
Kanegsberg, B.; Kanegsberg, E. Handbook for Critical Cleaning - Cleaning Agents and Systems, 2nd ed.; CRC Press: Boca Raton, FL, 2011. |
|
3. |
University of Massachusetts - Lowell. Toxics Use Reduction Institute. http://www.turi.org/ (accessed June 13, 2013). |
|
4. |
Hildebrand, J. H.; Scott, R. L. In The Solubility of Nonelectrolytes, 3rd ed.; Reinhold: New York, 1950. |
|
5. |
Hansen, C. M. Hansen Solubility Parameters: A User's Handbook; CRC Press LLC: Boca Raton, FL, 2000. |
|
6. |
Hansen, C. M.; Abbott, S.; Yamamoto, H. HSPiP Software. Hansen solubility parameters web site. http://hansen-solubility.com/ (accessed November 1, 2013). |
|
7. |
Krüss GmbH, Hamburg, Germany. Contact Angle and Surface Energy. http://www.kruss.de/en/theory/measurements/contact-angle.html (accessed October 28, 2013). |
|
8. |
Williams, D. L.; O'Bryon, T. M. Cleanliness Verification on Large Surfaces – Instilling Confidence in Contact Angle Techniques. In Developments in Surface Contamination and Cleaning; Mittal, K. L., Kohli, R., Eds.; Elsevier / William Andrew: Norwich, NY, 2013; Vol. 6, pp 163 - 181. |
|
9. |
Williams, D. L.; Jupe, C. L.; Kuklenz, K. D.; Flaherty, T. J. An inexpensive, digital instrument for surface tension, interfacial tension, and density determination. Ind. Eng. Chem. Res. 2008, 47 (12), 4286-4289. |
|
10. |
Williams, D. L. Determination of the Hansen Solubility Parameters for Cleaning Applications: Removing Polymeric Materials from Metal Surfaces; Plant-Directed Research and Development Program Contract 62896, under DOE Prime Contract Number DE-AC04-00AL66620; Sam Houston State University: Huntsville, TX, 2010. |
|
11. |
American Coatings Association. HMIS III - Hazardous Materials Identification System. http://www.paint.org/programs/hmis.html (accessed June 24, 3012). |
|
12. |
Godfrey, N. B. Solvent Selection via Miscibility Number. CHEMTECH, June 1972, 359-363. |
|
13. |
Perry, R. H.; Green, D. W. Section 15. In Perry's Chemical Engineer's Handbook, 8th ed.; McGraw Hill: New York, 2008; pp 34-39. |
|
14. |
Huskey, J. E.; Williams, D. L. Predicting Solvent Blend Miscibility. Texas Academy of Science 2013, Schreiner University, Kerrville, TX, 2013; p P547. |
|
15. |
Durkee, J. B. Description of Analytical Proceedures for Cleanliness Testing. In Management of Industrial Cleaning Technology and Processes; Elsevier: New York, NY, 2006; pp 455-460. |
RELATED CONTENT
-
Powder Coat MDF for an Enviable Finished Product
Cabinet maker says powder coating on wood offers more benefits.
-
Stripping of Plated Finishes
The processes, chemicals and equipment, plus control and troubleshooting.
-
VDA 19 and its Impact on European Manufacturing and Cleaning
The German Association of the Automotive Industry’s VDA Volume 19 is the first comprehensive standardization document for characterizing the cleanliness of products within the automotive industry’s quality chain.


