Electrodeposition of Ni-Fe-Mo-W Alloys - Part 4
4th-6th Quarterly Report - AESF Research Project #R-117. This NASF-AESF Foundation research project report covers the fourth through sixth quarters of project work (October 2013-June 2014).
#nasf #research #surfin
By Prof. E.J. Podlaha-Murphy, A. Almansur, A. Kola and K. Duarte, Northeastern University
Editor’s Note: This NASF-AESF Foundation research project report covers the fourth through sixth quarters of project work (October 2013-June 2014). A printable PDF version is available by clicking HERE.
Featured Content
Introduction
The project, initiated in January 2013, addresses the induced codeposition of molybdenum and tungsten alloys with nickel and iron having a focus on developing a toolbox of plating conditions to deposit different combinations of Ni, Fe, Mo and W. This paper covers progress made during the fourth, fifth and sixth quarters.
Through NASF-AESF Foundation funding, several students, both graduate and undergraduate, have gained experience in surface finishing research. In this nine-month period, there has been a change in student participation. Undergraduate student Matthew Silva completed his degree and started employment at Physical Sciences Inc. A new undergraduate student, Abdullah Almansur, a Northeastern University sophomore, began training in the lab, and is currently working on the hydrogen catalysis properties of NiMoW. Graduate student Avinash Kola continues work on the influence of deposition conditions on the properties of the NiMoW alloys. Finally, undergraduate student Kimberly Duarte is working on assessing the corrosion properties of novel NiMoW alloys.
NiMoW Deposition and Hydrogen Catalysis
Abdullah Almansur, undergraduate student
In earlier project work, a non-ammonia electrolyte was developed for NiMoW electrodeposition. Figure 1 shows a deposit from earlier work created on a rotating Hull cell. The electrolyte contained 0.15M nickel sulfate, 0.005M sodium molybdate, 0.075M sodium tungstate, 0.375M sodium citrate, and 1.0M boric acid at pH 7.0. The Hull cell deposit, with a variation in current density, was deposited with an average current density of 16.5 mA/cm2. The deposit composition, previously reported, is shown in Fig. 1(b) for reference.
Different regions of the deposit were tested for their ability to catalyze hydrogen. The polarization data in Fig. 1(c) is a test of three different deposit current density regions: a low current density (8.25 mA/cm2), a medium current density (33.0 mA/cm2) and a high current density (164 mA/cm2). Deposition was carried out on a rotating cylinder electrode, at 500 rpm, in 1.0M sodium hydroxide.
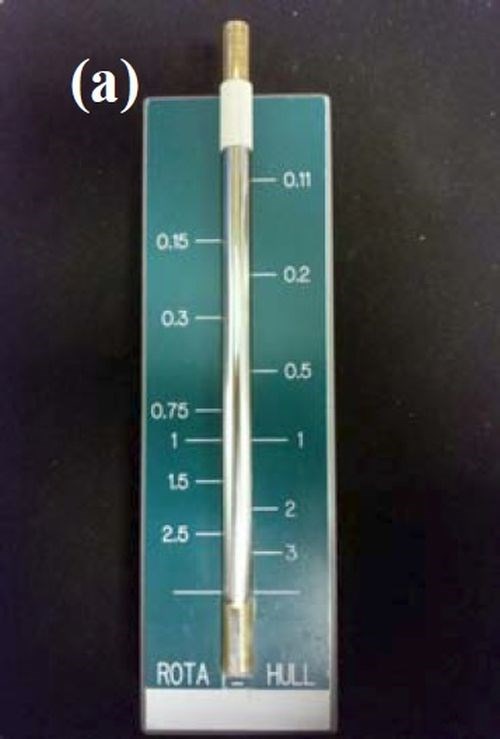
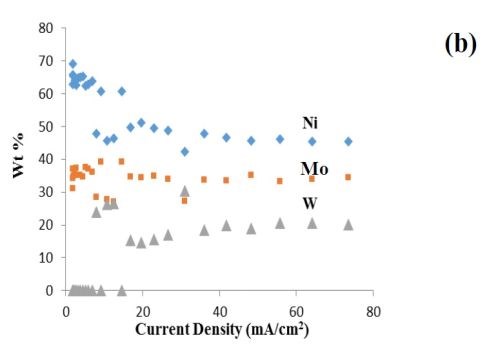
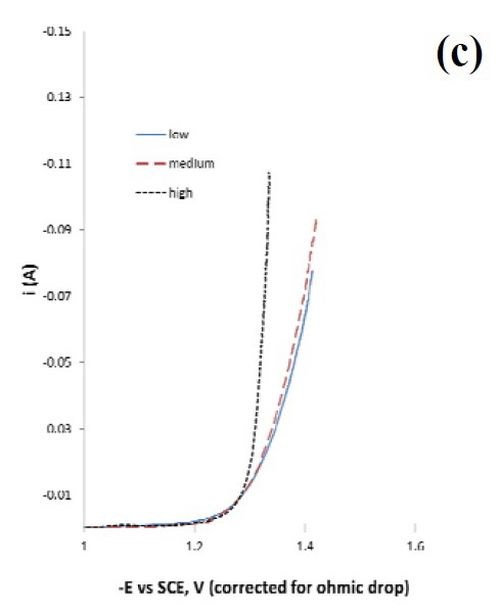
Figure 1 - Rotating Hull cell study of an electrolyte containing Ni, Mo and W at 500 rpm, at an average current density of 16.5 mA/cm2, (a) electrode and a scale representing a primary current distribution and a local current density estimate, (b) composition and (c) testing of hydrogen evolution of this deposit at a low, medium and high current density in 1.0M NaOH; electrode area = 1 cm2.
Since NiMo and NiW are both known to be excellent catalysts for hydrogen evolution, the combined NiMoW deposits were tested for their ability to catalyze hydrogen from water reduction in a basic electrolyte, 1.0M NaOH, at room temperature. The polarization data reflecting the hydrogen evolution reaction was similar for the low and medium current densities, while the current density was considerably higher, with an increase in the inverse Tafel slope for the high current density case. The elemental compositions of these alloys were:
• Low current density (8.25 mA/cm2): 27 wt% Mo, 39 wt% Ni, 34 wt% W
• Medium current density (33.0 mA/cm2): 26 wt% Mo, 42 wt% Ni, 32 wt% W
• High current density (164.0 mA/cm2): 36 wt% Mo, 45 wt% Ni, 19 wt% W
Thus, the significantly better hydrogen kinetics of the high current density deposit may be related to the larger amount of nickel and molybdenum, compared to tungsten in the deposits.
The value of the Tafel slope for the high current density deposit was 48 mV/decade. This value is consistent with the Volmer-Heyrovsky mechanism for hydrogen evolution according to:
(Step 1) H2O + e- ⇔ Hads + OH- (1)
(Step 2) Hads + H2O + e- ⇒ H2 + OH- (2)
If the second step were the rate determining step, and the coverage of adsorbed hydrogen species small, the Tafel slope can be derived as ([(ß2+1)F/(RT2.303)]-1 ~ 40 mV/decade, assuming that the symmetry factor, 2, is ~ 0.5. A higher coverage will increase this value, and the inverse Tafel slope falls as it does for the low current density and medium current density curves in Fig. 1. Thus, a good catalyst would be one that does not substantially increase the adsorbed intermediates, but allows them to occur at a low coverage, hence the increase in the amount of tungsten may play a negative role in this regard.
Factorial Design with NiW Deposition, Part 1: The effect of additives/complexing agents
Avinash Kola, graduate student
A Hull cell is a wonderful tool to assess the effect of current density on deposit quality and composition, as long as the reaction is relatively fast, so that ohmic effects dominate the current distribution. In exploring the influence of multiple variables other than current density on the resulting deposit composition, quality and current efficiency, the number of experiments can quickly become unwieldy. For example, in our studies of Ni-W from ammonium ion-free, citrate electrolytes, we wished to explore different additives and complexing agent additions to see which ones affect the deposit composition and thickness. In a non-factorial design approach, with three variables, one variable is changed while the other two variables remain constant at a certain applied current density or potential. The first variable is then held constant and another is varied, etc. In this manner, a large number of experiments are required. For example, if only four values of each variable are planned, then for three variables, 43 experiments are required to assess if the variable increases or decreases the deposit composition and/or the resulting thickness for a given deposition time. Replicating the experiments should also be included, so that if each experiment is done three times, the total number of experiments becomes 3 × 43, or 192 experiments.
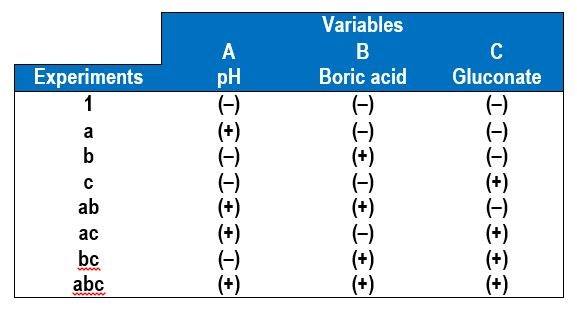
In a factorial design approach,1 only two values of each variable, or factors, are selected, a low value (-) and a high value (+). All possible combinations of factors can be investigated in 23 experiments, with additional experiments for replication. In general, for k variables or factors, the smallest subset of experiments is 2k. Table 1 shows the eight combinations of experiments needed to assess how three factors affect the deposit outcome. The names of the experiments are those used by Montgomery, et al.1 and reflect which variable is the higher amount. For example, the experiment name “a” corresponds to electrodeposition carried out when variable A is at a high value but the other two variables B and C are at low values. In this case, we chose our variables to be A = electrolyte pH, B = electrolyte concentration of boric acid and C = electrolyte concentration of gluconate. In contrast, experiment “bc” is conducted under conditions where the pH is low and the amount of boric acid and gluconate is high.
Table 1 - A 23 experimental design showing the low (-) and high (+) values of the different variables.
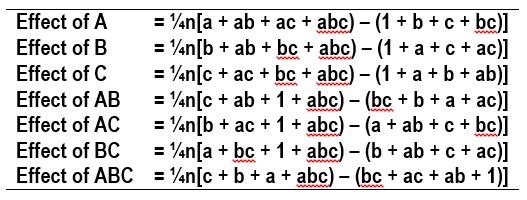
The influence of a variable on the desired outcome, such as deposit composition, can be assessed by “effects,” which are parameters determined by taking the averages of the desired outcome values, such as wt% W, shown in Table 2. The effects are calculated for each variable and its interaction with other variables on the desired outcome. The number of replicates are designated as n, and the values of the outcomes, such as wt% W, are used for the corresponding experiments, a, b, c, ab, ac, bc and abc.
Table 2 - Equations used to calculate the average value of the measured outcomes in the 23 experimental design with n replicates.
The electrolyte examined contained 0.5M nickel sulfate, 0.15M sodium tungstate, 0.5M trisodium citrate and a high and low amounts of the pH (8, 2), boric acid (0.5M, 0M), and gluconate (0.5M, 0M). The applied current density was 30 mA/cm2. The effect of pH, boric acid and gluconate on the wt% W in the deposit was determined. Table 3 shows photographs and optical images of the deposits resulting from the factorial design experiments. In addition the resulting wt% W from an XRF analysis is given, assuming only nickel and tungsten are present. This analysis does not take into account any incorporated carbon or oxygen that may be present in the deposits.
The effects determined from the values of wt% W are shown in Fig. 2. The results suggest that electrolyte pH has a large, positive effect on the wt% W in the deposit. Thus increasing pH will lead to higher amounts of tungsten. The amount of boric acid in the electrolyte has a similar influence on the wt% W, but is not as strong as pH. The amount of gluconate has a very minor influence on the wt% W because its effect is small.
Table 3 - Summary of the factorial design experiments, deposit photographs and wt% W.
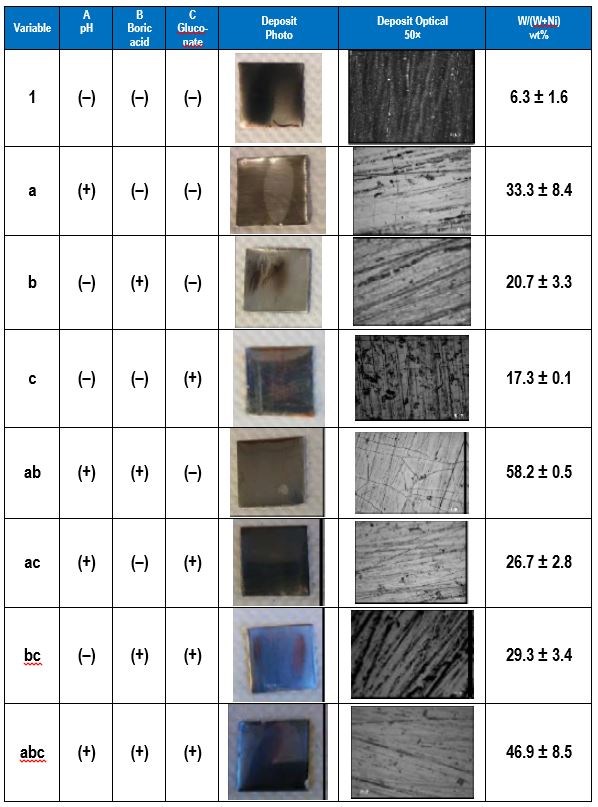
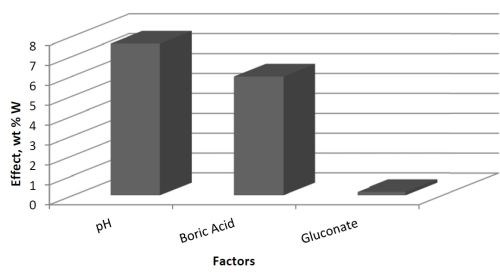
Figure 2 - Effects of the three factors: A = pH, B = boric acid concentration and C = gluconate concentration.
Traditional research methods generally study the effect of one variable at a time and therefore cannot assess if two factors are interdependent. A strength of factorial design is that the interdependence of two factors, or variables, can be identified. Figure 2 shows the combined factors. Increasing both pH and the concentration of boric acid in the electrolyte will increase the deposit wt% W. However, there is a negative influence of increasing pH with an increase in the gluconate concentration. There is a small negative effect of combining boric acid and gluconate together that contributes to a drop in the amount of tungsten in the deposit. That is therefore not an advantage in achieving significant amounts of tungsten, and gluconate was not studied further.
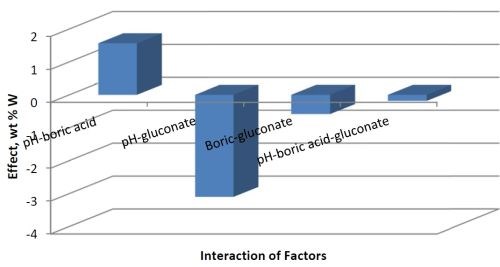
Figure 3 - Combined effects influencing wt% W.
Factorial Design with NiW Deposition, Part 2: The effect of temperature
Avinash Kola, graduate student
There is a large amount of data and information on electrodepositing NiW alloys from ammonia-based electrolytes, as noted in several good reviews on this subject.2-4 Ammonium hydroxide is often added to these electrolytes in order to achieve high current efficiencies in excess of 60%, although with relatively low amounts of tungsten in the deposit. Vasauskas, et al.5 stated that ammonia species provide a large buffering capacity at high pH that may contribute to the high efficiency. Decreasing the amount of ammonia in the electrolyte can be used as a strategy to increase tungsten in deposits when codeposited with nickel, albeit at low current efficiency, ≤10%, as noted by Younes and E. Gileadi.6 The addition of ammonium hydroxide to aqueous solutions can yield appreciable aqueous ammonia depending on the pH, which can be problematic in a plating line since the ammonia readily volatilizes, and can be oxidized at the anode. Thus its concentration is not easy to maintain. From a health perspective, chronic exposure to ammonia can irritate the eyes, nose and upper respiratory tract.7 Thus, deposition of NiW alloys from an ammonia-free electrolyte would be advantageous. CoW alloys having up to 51 wt% W and current efficiencies of 50% have been reported from ammonia-free electrolytes containing gluconate by Weston, et al.,8 and similar results have been achieved in citrate-boric acid electrolytes at neutral pH for CoW.9,10 In an analogous approach, an ammonia-free electrolyte was developed with sodium citrate with and without boric acid and gluconate in this project.
In the previous discussion, a factorial design approach was used to assess the influence of pH, boric acid and gluconate concentration in an electrolyte that contained 0.5M nickel sulfate, 0.15M sodium tungstate, 0.5M trisodium citrate and a high and low amounts of the pH (8, 2), boric acid (0.5M, 0.0M), and gluconate (0.5M, 0.0M). The applied current density was 30 mA/cm2. The effects of the three parameters were determined and it was found that gluconate concentration had a minor influence on the composition. In the next phase of this study, the gluconate was eliminated and temperature was added to a 23 factorial design.
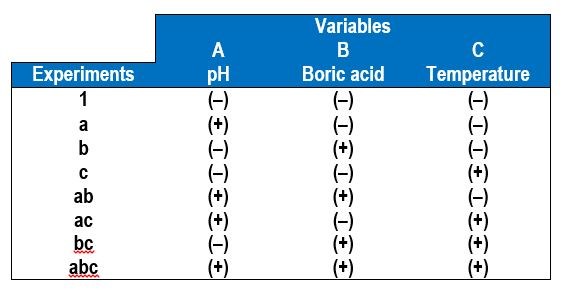
Table 4 shows the eight combinations of experiments needed to assess how three factors affect the deposit outcome, in this case, A = electrolyte pH, B = electrolyte concentration of boric acid and C = electrolyte temperature. In addition to measuring the wt% W in the deposit by XRF, the deposit thickness was also determined to reflect the relative current efficiency. Deposition was carried out at a constant current density of 30 mA/cm2, for a deposition time of 30 min.
Table 4 - A 23 experimental design for operational parameters showing the low (-) and high (+) values of the different variables.
The data is shown in Table 5. The high and low values of temperature were 60°C and room temperature (22-25°C). The effects were calculated from the measured values of wt% W and deposit thickness, with n number of replicates, which in this case is three.
Table 5 - Summary of the factorial design experiments, deposit photographs of the deposits, wt% W and deposit thickness.
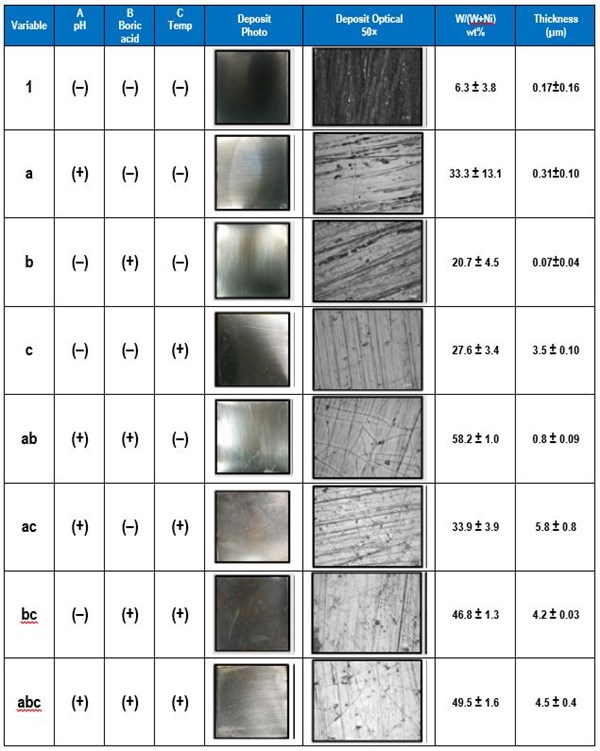
Figure 4 shows the effects of the three parameters: pH, boric acid concentration and temperature. At the top of Fig. 4 the influence of the parameters on two outcomes are presented. The wt% W (right) and thickness (left) show that the pH has the strongest influence on changing the wt% W and the temperature has the greatest influence on thickness. The actual value of the wt% W is not a particular goal, but rather it is important to know how the parameter influences the deposit composition. This can point to ways to design the deposition conditions. The thickness, and hence the current efficiency, is most influenced by temperature, although the concentration of boric acid can also increase the deposit thickness since it also has a positive effect value. The graphs on the bottom of Fig. 4 show potential interaction influences, that are sometimes difficult to assess in other experimental procedures and unique in factorial design. Note that the effects values are negative for some factor combinations, such as the boric acid factor with temperature in determining the wt% W. In other words if both boric acid and temperature were increased together, then the amount of wt% W in the deposit would decrease, even though separately they do just the opposite. Similarly, although an increase in pH has very little influence on the deposit thickness, if it is increased along with the boric acid concentration and temperature together, the thickness is expected to decrease (Fig 4, lower right graph).
A few of the samples were examined with SEM. Figures 5 and 6 compare the two samples that were deposited at the low temperature (RT, 22-25°C) and high temperature (60°C) with boric acid. To the eye, the deposits look shiny grey and reflective as in the photograph in Table 5. Under SEM examination, cracks and pits are clearly evident, likely the result of the hydrogen evolution side reaction. There is a higher density of cracks at the lower temperature (Fig. 5(a)) than at the higher one (Fig. 5(b)). Interestingly, there are multiscale pits evident at higher magnification. At low temperature the surface seems to have qualitatively more larger pits (~200 nm, Fig. 6(a)), and at the higher temperature, there are more numerous smaller pits with a large variation of size (~20-100 nm, (Fig. 6(b)). Note the whitish region surrounding the large pits. The white areas are due to the charging effect in the SEM and may be reflective of the less conductive hydroxide species being formed, owing to local pH changes. The morphology in the metallic regions looks different at low and high temperature. Both have a nodular-like appearance but they are smaller at low temperature than at the high temperature. This feature may be a signature of the grain size, but morphology in electrodeposition does not always indicate grain size. A cross-sectional sample would be needed to know definitively and is planned for future work.
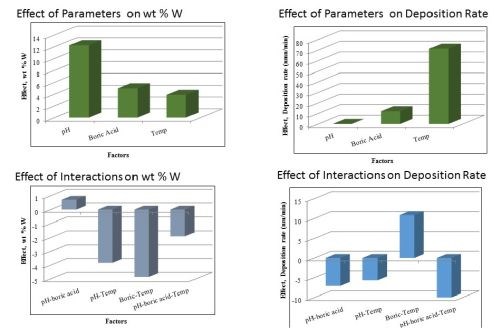
Figure 4 - The influence of the three parameters on the wt% W and thickness (top) and the interactions effects of the variables (bottom).
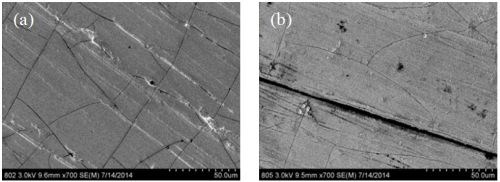
Figure 5 - SEM images at 700× magnification of NiW deposits at (a) room temperature and (b) 60°C.
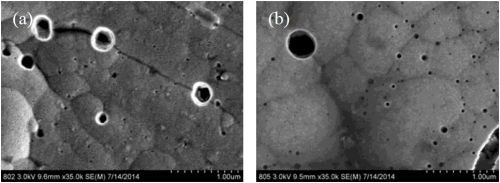
Figure 6 - SEM images at 35,000× magnification of NiW deposits at (a) room temperature and (b) 60°C.
Figure 7 compares two deposits fabricated without the presence of boric acid in the electrolyte and with boric acid in the electrolyte at 60°C. There are about the same number of micro-cracks in the deposits, but one significant difference is that there is a more non-uniform morphology when the boric acid is not present. It is known that boric acid can help to buffer the surface, so the change in morphology may be related to local pH changes. Figure 8 shows a higher magnification of these deposits, again showing the nano-scale pits, but also showing small crystallites on the sample without boric acid. These small features have a brighter contrast and suggest a difference in composition with elements that would make that region less conductive, such as boron or hydroxide compounds.
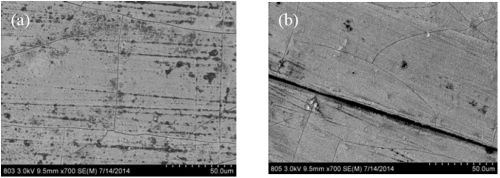
Figure 7 - SEM images at 700× magnification of NiW deposits at 60°C, (a) without and (b) with boric acid.
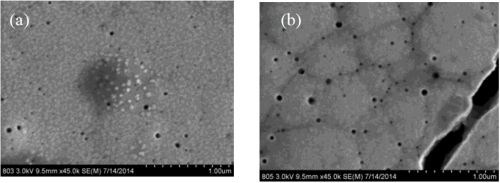
Figure 8 - SEM images at 35,000× magnification of NiW deposits at 60°C, (a) without and (b) with boric acid.
Corrosion of Alloys in Artificial Sweat
Kimberly Duarte, undergraduate student
The objective of this sub-project was to examine the corrosion properties of some of the alloys deposited from the ammonia-free electrolytes in an artificial sweat solution. The motivation for this study was to address the nickel dermatitis problem. Nickel dermatitis, a sensitization to nickel, is a growing problem resulting in a skin rash when in contact with nickel from a variety of common items, including jewelry, razors, belt buckles and cell phones.11,12 It has been such a concern that in 2008, nickel was selected “Allergen of the Year” by the American Contact Dermatitis Society.13 While the properties of nickel are superior in many applications, a recent strategy has been to reduce or eliminate the corrosion of nickel when in contact with skin. Most notably, Sn-Ni alloys exhibit significantly better corrosion resistance than nickel, having unique corrosion properties that include surface passivation much like that of stainless steel.14 However, skin sensitivity to tin cannot be completely excluded,15 and the added weight of tin can make the resulting alloy less desirable. Although molybdenum and tungsten alloys have the same problem of added weight to the resulting material, they do promote corrosion resistance through a spontaneous surface film formation.
In this work, we focused on depositing Ni-Mo-W alloys from the following electrolyte: 1.0M boric acid, 0.375M sodium citrate, 0.075M sodium tungstate, 0.005M sodium molybdate, 0.15M nickel sulfate, pH 7.0, adjusted with sodium hydroxide, using rotating cylinder electrodes. Electrodeposition was carried out at a rotation rate of 500 rpm (electrode diameter = 0.6 cm), with brass substrates, and at high and low deposition current densities of 65 mA/cm2 and 33 mA/cm2, respectively. The deposit composition was measured by XRF. The composition was richer in tungsten at the higher current density (42 wt% W, 37 wt% Ni, 21 wt% Mo) compared to the lower current density, (32 wt% W, 42 wt% Ni, 26 wt% Mo).
Corrosion studies were also completed using the rotating cylinder working electrode (Fig. 9), using a dimensionally stable anode (DSA) and a Ag/AgCl reference electrode. Polarization curves were generated in an artificial sweat solution, containing 0.05M sodium chloride, 0.01M lactic acid, 0.02M urea, pH 6.5 adjusted with ammonium hydroxide, adapted from Jellesen and Møller.14
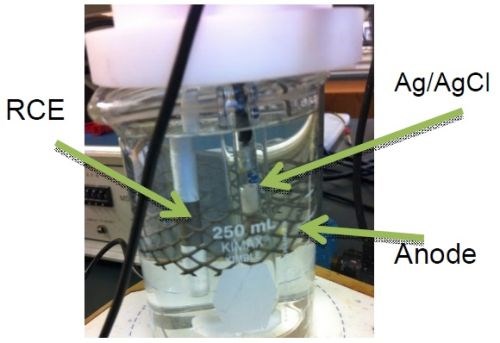
Figure 9 - Photograph of the rotating cylinder cell with a dimensionally-stable anode and a Ag/AgCl reference electrode.
Figure 10 is a plot of the resulting polarization curves of the two NiMoW alloys compared to their brass substrates. The sample with the lower tungsten amount exhibited lower corrosion currents and a more positive corrosion potential than the substrate. The sample deposited at higher current density fared worse. These samples were compared to other deposits made in earlier work: an iron-rich FeMoNiW, and a NiMo deposit that had comparable nickel content (Fig. 11). The Fe-rich sample exhibits the poorest corrosion properties, with a higher corrosion current density and the most negative corrosion potential. The NiMo alloy is in between the two NiMoW samples in corrosion properties.
A better way to compare all the samples is to compare their corrosion exchange current densities (i.e., corrosion current density at open circuit conditions), the Tafel slope along with the corrosion potential. These parameters are shown in Table 6. The results point to the best performing deposit having NiMoW with small amounts of tungsten, being better than NiMo alone or when there is more tungsten with NiMo. Further studies with different amounts of tungsten in the NiMoW deposits are planned in future work. It is interesting to note that the brass electrode shows passivation near -0.2 to -0.1 VAg/AgCl and, at -0.1 VAg/AgCl has the lowest corrosion current, although the corrosion potential is less noble than the NiMoW alloy with the low content of tungsten.
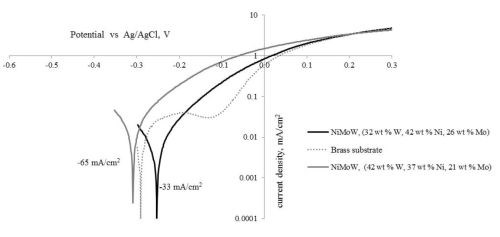
Figure 10 - Polarization curves of two NiMoW alloys, and the brass substrate in an artificial sweat solution, sweep rate 2 mV/sec.
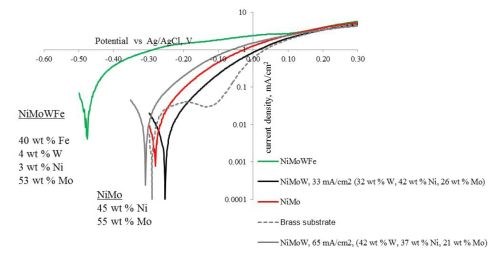
Figure 11 - Polarization curves of two NiMoW alloys, NiMo, Fe-rich alloy and the substrate in an artificial sweat solution, sweep rate 2 mV/sec.
Table 6 - Summary of corrosion characterization parameters for the curves shown in Fig. 11.

Conclusions
A number of students, at both undergraduate and graduate levels, have participated in the research project, continuing work on NiMoW and NiW electrodeposition. Contributions by undergraduate sophomore Abdullah Almansur have helped to characterize deposit composition associated with deposits used in to catalyze the hydrogen evolution reaction from base solutions.
Graduate student Avinash Kola continued work in Ni-W looking at different additives and complexing agents on the deposit composition. A factorial design approach can be a good place to start to assess different variables in a plating bath. In our first study, we used this approach to look at the influences of boric acid, pH and gluconate in a sodium citrate NiW electrolyte. The gluconate was found to have a minimal effect on wt% W in the deposit. In the second factorial study, we replaced gluconate with electrolyte temperature and found that the effect of temperature not only increases the deposit thickness but also the wt% W in the deposit. The synergistic influences when variables are combined change the deposit composition in unexpected ways, such as a decrease in deposit thickness when pH, boric acid and temperature are all increased altogether. The ability to observe the interaction effects is what makes the factorial design approach beneficial.
A new undergraduate student, Kimberly Duarte, joined our effort to explore the corrosion properties of NiMoW alloys in artificial sweat solution to assess corrosion in hand-held applications. NiMoW having a smaller amount of tungsten, but not zero, fared the best. Higher levels of tungsten, plated at higher current density, had a more negative corrosion potential but a similar corrosion current density. A NiMo alloy with comparable nickel content was not as good as the NiMoW deposit having lower amounts of tungsten. An iron-rich deposit was by far the worst corrosion resistant material.
References
1. D. Montgomery, G. Runger & N. Hubele, Engineering Statistics, 2nd Ed., John Wiley & Sons, Inc., New York, NY, 2001; pp 362-395.
2. N. Tsyntsaru, H. Cesiulis, M. Donten, J. Sort, E. Pellicer & E. J. Podlaha-Murphy, Surface Engineering and Applied Electrochemistry, 48 (6), 491-520 (2012).
3. N. Eliaz & E. Gileadi, Modern Aspects of Electrochemistry, 42, 191-301 (2008).
4. T. Akiyama & H. Fukushima, ISIJ International, 32 (7), 787-798 (1992).
5. V. Vasauskas, et al., Mechanika, 72 (4), 21-27 (2008).
6. O. Younes & E. Gileadi, J. Electrochem. Soc., 149 (2), C100-C111 (2002).
7. G.J. Hathaway & N.H. Proctor, Proctor & Hughes’ Chemical Hazards of the Workplace, 5th Ed., John Wiley & Sons, Inc., New Jersey, 2004.
8. D.P. Weston, et al.¸ Electrochim. Acta, 55 (20), 5695-5708 (2010).
9. N. Tsyntsaru, et al., Trans. Inst. Met. Finish., 86 (6), 301-307 (2008).
10. N. Tsyntsaru, et al., Sur. Coat. Tech., 206 (19-20), 4262-4269 (2012).
11. P. Møller, et al., “Electroplated Tin-Nickel Coatings as a Replacement for Nickel to Eliminate Nickel Dermatitis, SUR/FIN 2013 Conference, Rosemont, Illinois; NASF Report in Products Finishing, NASF Surface Technology White Papers, 78 (3), 15-24 (2013); http://short.pfonline.com/NASF13Dec2.
12. L. T. Menné & D. Burrows, British Journal of Dermatology, 134 (2), 193-198 (1996).
13. American Contact Dermatitis Society, http://www.contactderm.org/i4a/pages/index.cfm?pageid=3467 (Last accessed 09/10/2014).
14. M.S. Jellesen & P. Møller, Plating and Surface Finishing, 92 (10), 36-41 (2005).
15. T. Menné, et al., Contact Dermatitis, 16 (1), 9-10 (1987).
RELATED CONTENT
-
The Adhesion of Electrodeposits to Plastics
The 1966 Carl E. Huessner Gold Medal Award was given to Dr. Edward Saubestre and co-workers for Best Paper appearing in Plating in 1965, and their paper is republished here in a series on the AES/AESF/NASF Best Paper Awards. This paper is a comprehensive treatise on the Jacquet peel test, a primary test method for determining adhesion on plated plastics.
-
PFAS and the Surface Finishing Industry
NASF and its member companies have a long history of environmental stewardship, especially when it comes to PFAS.
-
Hybrid Sol-Gel Coatings in Surface Engineering
A look at the use of modified sol-gel polymer films and hybrid system coatings, as well as the methodologies for evaluating the mechanical properties of the coatings.


