Evolution of Electroless Nickel Plating
What’s next for EN technology?
#basics
From a historical perspective, the past growth of electroless plating is traceable to many factors, but three key drivers over the years helped spur regrowth of the technology: 1)the discovery that some alloys produced by electroless deposition have properties ideally suited for a range of engineering applications compared with other electroplating technologies, notably nickel-phosphorus; 2) growth of the electronics industry, especially the further refinement of printed circuits and continued requirements for miniaturization; and 3) larger-scale introduction of lightweight materials for improved fuel efficiencies and greater requirements for low-cost substrates including plastics, neodymium used in super magnets, traditional aluminum alloys or alloy steels that require enhanced corrosion performance or barrier layers.
For five decades, the industry has witnessed numerous applications benefit from electroless nickel (EN) deposits, meeting many types of engineering requirements.
Since 2002, the evolution of EN has made great progress. For a brief time during early development, there was chaos and uncertainty about whether success would prevail—that our industry would be able to successfully replace lead stabilizers.
Featured Content
Over the past decade, the National Association for Surface Finishing (NASF) and the Surface Finishing Market Research Board (SFMRB) have conducted market surveys of the metal finishing industry. Report No. 10 in 2007 was the industry’s first comprehensive market study in some time that provided input regarding the use of ELV-type chemistry. Some follow-up survey reports looking at growth indexes have shown that in 2006 non-lead EN chemistry types made up 18 percent of the NAFTA EN market, but that number had grown to 30 percent by 2009. Based on results of the 2013 report, and extrapolation from the total EN market sales extrapolated in 2014, the percentage of non-lead EN technology was near 60 percent of the total EN market value. This estimate and trend continues to demonstrate the advances and improved performance that these non-lead stabilized chemistries provide compared to their ancestors.
Continued regulatory demands and further impact as a result of the REACH initiative continue to push chemistry providers who want to maintain a leadership position or maintain existing business to tweak and find further improvements for their non-lead EN systems. For some suppliers, continued reinvestment into EN R&D is paying dividends. Who would have thought that within a decade, the industry could replace prior stabilizing systems and additives—successfully used in commercial processes over the previous three decades—with Ni-P alloys that have been used across many industries for a vast number of other applications? Now there are numerous examples today of where EN environmentally friendly systems outperform their predecessor lead-stabilized systems.
What’s Next?
The simple answer is that applicators want greater value and benefit but for less cost. This perceived greater value focuses on improved system performance to meet environmental demand. But this mindset also recognizes that any lower operating cost structure can be favorable and is still a common demand of the market. This approach appears to be critical toward business sustainability: the long-term mindset where ecology and economy merge into one and humans live within the limits of available resources and the ultimate impact on the environment.
EN development will result in optimized or unique deposit characteristics, and optimized EN solution performance focusing on eco-responsible, or what could be called “eco-optimized,” technology. During the past several years, in particular, as a direct result of market and environmental demands, we have been moving into this EN-development phase of eco-optimized technology, a fifth generation of EN platforms that offers many potential benefits for the EN applicator. The chronology of EN technology evolution is as follows:
1st Generation ~ 1955–1960
Kanigen - 7-10% P, difficult to operate, general purpose EN. No longer a lab curiosity.2nd Generation ~ 1970–1980
High corrosion resistance, high-phosphorus EN developed by commercial pioneering companies like Elnic and Allied Kelite3rd Generation ~ 1980–2000
Wide expansion of available processes, including composites, low-phosphorus, ternary alloys. Many suppliers provided technology.4th Generation ~ 2000–present
Lead-free and cadmium-free systems, and long-life systems developed.5th Generation ~ 2012–future
Eco-optimized technology.
As a formulator and supplier of EN technology, it’s exciting to be in this next evolutionary phase of EN development and provide the market an answer to the question, “What can you do for me tomorrow?”
Optimized deposit characteristics will likely be a result of advancements in formula and operating conditions. New additives that modify structure could lead to reduced porosity or increased resistance to chemical attack. Although ternary alloys have never caught on in high-demand/volume commercial applications due to poor cost/benefit ratios, this potential always exists in light of increased nano-technology developments. There are some interesting potential new alloys or combinations of different coatings that could offer some further advancement in the EN evolution that would increase demand. We are already seeing the first few signs of anti-counterfeit technology embedded as a composite promoted by a handful of companies. This may provide a boost to the existing EN composite market that has never quite gained sufficient momentum to see growth of EN outside of the traditional markets.
Improvements are being evaluated, such as optimized EN bath performance to increase deposition speed and improve tank stability without needing additional equipment. This would have a direct impact on applicator productivity. We also continue to see EN bath life extension technology under continuous evaluation. Membrane/electrodialysis technology is readily available from several suppliers, but there are even simpler technologies that demonstrate promise for removal of EN reaction byproducts that results in bath life extension, but not without some cost considerations. Alternative forms of nickel chemistry can also extend EN solution life, but requires additional considerations, depending on the final application. Of course all applicators want a cost-effective EN system that can provide consistent deposit and system performance over a maximum number of metal turnovers. These alternative, non-equipment types of long-life-chemistry approaches today can achieve up to 30 percent, sometimes 40 percent, solution life extension, however they do present some trade-offs when compared with traditional EN chemistry.
Eco-responsible technology is only going to grow. The technology to extend EN solution bath life mentioned above is certainly part of this, but there are other opportunities to make an EN process greener. Chemistries that operate at lower temperatures or at lower ionic strength offer obvious benefits, and reducing emissions with certain novel additives are already demonstrating benefits as well.
Still, even with the development of this next generation of EN systems, until other alloys are commercially viable, nickel phosphorus EN deposits will continue to provide many important engineering properties for a number of applications.
Importance of Standards
EN specification documents—vital for suppliers, purchasers and consumers—are intended to help coating specifiers and applicators understand performance requirements and assist them in reaching agreement on expectations in supplying EN-plated parts. Specifications may be written by government agencies; standards organizations such as the American Society for Testing and Materials (ASTM) and International Organization for Standardization (ISO); trade associations like the Materials Information Society (ASM International); private corporations; and many others from the automotive sector, aerospace or machinery equipment companies. These documents are referred to as “in-house” or proprietary standards that are often influenced by consensus standards.
Industry consensus standards or public documents focusing on EN technology include ASTM B-733, ASTM B-607, AMS-C-26074 (formerly Mil-C-26074), AMS 2404, AMS 2405, AMS 2399 and ISO 4527. These are all good references. A well-written spec provides insight and performance, but still requires some level of maintenance. The evolution of ASTM documentation is a good example of how specifications improve over time.
ASTM B733-90, for example, was approved in 1990 and has since been revised twice, in 1997, 2004 and reaffirmed in 2009. The updated version is clearer and more concise than the earliest version and provides a good starting point for understanding EN technology. International standard ISO 4527 further improves upon the ASTM-B733 specification.
Part drawings can include out-of-date specifications that can potentially result in problems. Most specifications do not change as dramatically as the ASTM B 733 did, but good communication between the purchaser of the coating and the applicator can help avoid a misapplication. Today, AMS 2404 is in revision H (July 2017) and AMS-C-26074 is in revision D (June 2013), and should be reviewed for the most up to date information.
Resistance to Friction
Because Ni-P alloys possess a natural lubricity, all EN coatings have some level of resistance to many types of wear situations. Improved wear resistance enables softer parts, or components that would typically have poor abrasion resistance, to be used in applications otherwise not possible.
There have been studies of the relationships linking deposit phosphorus levels to the resulting deposit hardness both before and after post-plating heat-treatment processes. Depending on phosphorus content, EN deposits can be amorphous (>10.6 wt% P), crystalline (>4.5 wt% P) or a mixture of both (5–10.5 wt% P). Heat treatment of these deposits to different temperatures for given durations of time will cause structural changes, specifically crystallization through the formation of nickel phosphide (Ni3P), to occur in these deposits, which is responsible for hardness improvement.
Tribology—the study of wear—is relatively new compared with many other engineering topics, but over the years there have been many theories developed to describe mechanisms for various types of wear. These include corrosive or chemical erosion, cavitation, fatigue, fretting, impact, sliding, abrasion and adhesive wear interactions.
In real-time wear interactions, metal-to-metal contact and the condition and hardness of the contacting surfaces must be taken into account. Wear testing can be complicated, both inside and outside of the laboratory, which is another reason Ni-P deposit hardness has traditionally been used as a gage to indicate wear performance. It has been accepted that if the EN deposit is hard, or hardened by post-plating heat treatment, the deposit will have improved wear performance. Acceptance of this premise helps to perpetuate the deposit-hardness falsehood. There have been a limited number of papers published over the years that have extensively studied the heat treatment performance of ENP deposits above 400°C. However Nava et.al., in 2013 published the “Effects of Heat Treatment on the Tribological and Corrosion Properties of Electrodeposited Ni-P Alloys”. This work summarized the effects of heat treatment on the hardness, wear resistance, coefficient of friction and corrosion properties of electrodeposited 10.6 percent w/w Ni-P alloy deposits. This work demonstrated that thermal treatments of this ENP deposit at temperatures greater than 500°C transformed the amorphous alloy into a continuous Ni3P layer containing isolated nickel crystals. Both decreased deposit hardness and decreased wear coefficient were observed after a one hour heat treatment cycle at temperatures less than 500°C and the samples thermally treated at 500°C possessed the greatest wear resistance, despite the deposit being less hard. The heat treatment annealing temperature from 0 to 500°C positively affected the electrochemical behavior utilizing methods from ASTM G102 and G59, of the 10.6 percent w/w Ni-P alloy deposit by deactivating the corrosion potential from -721.45 to -619.9 V versus SCE in this study. Work presented at the Electroless Nickel Conference 1999 by Evarts et.al., also demonstrated improved Ni-P wear and corrosion performance at temperatures higher than 400°C in their work, “High Temperature Heat Treatment of Electroless Nickel Deposits for Improved Resistance to Corrosion and Abrasion.”
Defining the wear resistance requirement for a deposit through the type of testing is important, but we must also acknowledge that testing any deposit in a comparative environment under similar conditions only serves as a predictor of performance under that specific set of conditions.
Traditionally, abrasive wear, adhesive wear and sliding wear have been the wear types most often documented for Ni-P alloys. Wear performance has also been shown to be primarily a function of the deposit hardness, and this has been related to alloy phosphorus content. ASTM B 733 references the Falex method (ASTM D 2670) of testing for adhesive wear, the Taber method (ASTM D 4060) for abrasive wear and the Alpha LFW-1 method (ASTM D 2714) for friction and wear testing.
Adhesive Wear Tests
Adhesive wear tests show relationships between interacting surfaces, but access to these tests and equipment can be costly. For this reason, adhesive wear testing often isn’t practical compared with abrasive wear tests, which are the type predominantly used to characterize coatings, including EN. Abrasive wear testing is more easily performed in your own lab because the equipment is readily available in the market.
Used to evaluate wear under conditions of dry abrasion, the Taber abraser test measures the weight loss of a rotating plated specimen panel by two dressed rubber-bonded abrasive wheels, usually using a 1,000-g load. Specimen wear is reported as the Taber wear index (TWI) in average weight loss in milligrams per 1,000 cycles. The Falex wear test has been used to measure adhesive wear with variables including load and revolutions per minute under both lubricated and non-lubricated conditions.
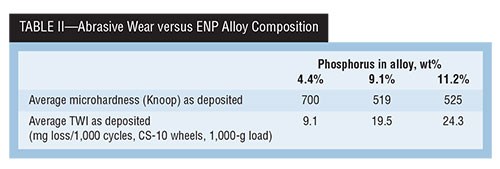
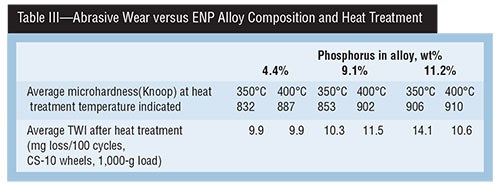
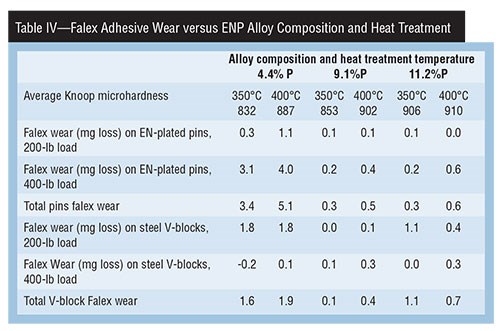
A study done in the late 1980s titled “Hardness & Wear Resistance of Electroless Nickel Alloys” is particularly relevant, because the same Ni-P alloy deposits were evaluated with two different test methods, and their correlation to deposit hardness in the “as deposited” and “as heat treated” conditions were examined. Tables II, III and IV present a summary of that data.
In the abrasive wear result, the Taber wear example data shows that high deposit hardness does not always equate to the best wear resistance. However, when looking at a different wear mechanism of adhesive wear using the Falex test method, we see a different outcome with the same deposit.
The data in Table II shows that, for the as-deposited alloys, the 4.4-percent P deposit has both the highest average hardness at 700 HK100 and the lowest resulting TWI (9.1-mg loss) compared with both higher-phosphorus deposits.
Table III shows that, as the 4.4-percent P deposit is heat treated at two temperatures (350 and 400°C), deposit hardness is lower than that of the 11.2-percent P alloy. However, TWI values show that the 4.4-percent P alloy lost only 9.9 mg at both heat treatment temperatures, while the 11.2-percent P alloy had higher TWIs of 14.1 and 10.6 mg, indicating improved abrasive wear with a harder, heat-treated deposit surface.
Falex wear results shown in Table IV indicate several important characteristics. For example, the 11.2-percent P deposit on the pins had the highest average hardness (906–910 HK100), but had no better adhesive wear performance than the 9.1-percent P alloy. It was, however, much better than the 4.4-percent P alloy.
High Hardness, Low TWI
The wear on each of the V-blocks (hardness Rc 20–24) from each plated pin shows the 9.1-percent P alloy had the least total wear impact on the V-block at both heat treatment temperatures. The other two deposit compositions had much more adhesive wear impact.
Adhesive wear testing is challenging because of all the potential variables, such as load, lubrication, duration of test, break-in period, and hardness and coating of V-blocks. Many conclusions can be drawn from this study. However, it does show that the 4.4-percent P alloy had better Taber (abrasive wear) performance and poorer Falex (adhesive wear) performance, and that its range of average micro-hardness after heat-treatment was not the highest. The high-phosphorus (11.2-percent phosphorus) deposit, despite having the highest average micro-hardness after heat treatment, had poor abrasive wear resistance and not the best adhesive wear result.
Specifying Details is Important
More significantly, the data shows that the belief that the highest deposit micro-hardness provides the best wear performance does not always hold true.
Since the early days of EN, there has been much written about the coating’s ability to provide a level of defined corrosion performance in the environment where it’s exposed.
EN deposits, like electrodeposited nickel, are cathodic coatings over most substrates and function as barrier coatings and act to protect substrates by a mechanism of encapsulation, which helps to seal them off from exposure. Once this barrier is penetrated, the protective value of the deposit is lost. In contrast, anodic coatings, such as zinc plating over steel, provide protection to the substrate by sacrificially corroding themselves relative to the substrate.
Recognizing that corrosion test methods are most useful for comparative purposes—which may or may not represent actual service conditions—is important. The best approach is testing of EN deposits under the conditions of exposure they will see in service. Since this is not always practical, there are a number of alternative exposure tests, including neutral salt spray, which can be used as a corrosion protection test based on deposit porosity. A problem with this approach is that deposit porosity can be impacted by EN operational factors, substrate surface conditions and incorrect requirements for deposit thickness.
Any defined degree of corrosion performance for an EN deposit is determined by many factors related to its exposure. Will the deposit be exposed to an acid or alkaline environment? At what given concentration of media? Will there be an oxidizing or reducing atmosphere, at what exposure temperature? Is the exposure wet or dry? For this reason, actual time exposure tests to the environments where the deposits will be used are more meaningful and should be carried out whenever possible.
Corrosion Tests to Use
Because real-time corrosion resistance is reflected by resistance to attack by chemical reaction, there are many corrosion tests that can be used to evaluate Ni-P deposits. For example, the resistance of deposits to blackening in nitric acid is a common test used in the electronics industry. A high-phosphorus deposit (>10 wt% P) provides better resistance to nitric acid exposure (no blackening of the deposit) with minimal attack compared with lower-phosphorus EN deposits.
High-phosphorus alloys also provide the best overall corrosion resistance in the widest variety of environments; however, their resistance has been shown to be relatively poor in strong alkaline mediums, and low-phosphorus EN deposits provide the best corrosion performance overall in these environments.
All EN deposits provide some level of protection by degree of encapsulation of the substrate, but not all have the same performance because porosity causes points of failure. Higher-phos EN deposits have the potential for producing least porosity, so generally speaking, they provide the best protection. Here's how the common EN specifications express corrosion performance requirements:
AMS 2404 rev H (July 2017)
- Carbon and low-alloy steel parts or test panels with minimum 25 µm after embrittlement relief, no corrosion of basis metal after 48 hrs to NSS (ASTM B117)
Although it is not stated specifically, the reference to Hydrogen embrittlement post baking implies that class 1, class 3 or class 4 would require to meet NSS requirements. Unfortunately, this is confusing since Class 2 is heat treatment for hardening of deposits that would cause nickel phosphide precipitation in the alloy. Deposit hardening results in cracks and increased porosity that would not consistently perform well in NSS testing.
AMS-C-26074 rev D (June 2013)
- Grade A coatings (0.001") for aluminum-based alloys on aluminum alloys and grade C coatings (0.0015") on iron alloys after plating and all thermal treatments shall show no visual evidence of corrosion of basis metal when exposed to NSS testing per ASTM B117 for 100 hrs
- Separate test specimens used for salt spray testing shall be 4" × 6" size
ASTM B733 -15 (updated 2015)
This document references porosity as measure of corrosion protection requirement. The Ferroxyl test, boiling water, or aerated water for iron based substrates can be selected. For aluminum substrates, the Alizarin test is preferred and for copper substrates there is a defined test outlined in the document. Also, in the appendix of the document, there are some other options if agreed to by purchaser and producer.
- Agreed by producer, pass immersion tests (Practice G31) or electrochemical test (Test Method G5 and Pratice G59)—No Neutral Salt Spray listed in the SPEC, but can be used as possible porosity test if agreed by producer and specifier
- For pitting corrosion resistance determination, see practice G85 acetic acid salt spray, Test Method B368 (CASS) or Test Method B380 (Corrodkote) to evaluate pitting tendency
ISO 4527 rev E (2003)
- If required, the corrosion resistance and corrosion test method shall be specified by purchaser who shall specify acceptance criteria in accordance with ISO 10289
- The test methods included in ISO 9227, acetic acid salt spray and copper accelerated salt spray, may be specified for evaluating pitting corrosion resistance of coatings.
Effect of Porosity
High-phos EN provides the greatest protection in the widest exposures because it has the lowest porosity and the highest deposit passivity, related to its amorphous structure as deposited. Still, all ranges of EN deposits provide some level of corrosion protection.
In various exposure environments, phosphorus content has been shown to have a significant effect on the coating’s protective value, which is also referenced in ASTM B 733, Appendix X5 with the Kure Beach corrosion study. The study showed that after many years of exposure, improved corrosion ratings (per ASTM B537 practice) of 9.5 or higher were obtained with higher phosphorus deposits. A rating of 9.5 represents 0.05 percent or less of the surface area showing corrosion.
Addressing this salt spray misconception, there are many references to EN deposits passing salt spray per ASTM B117, but the problem is that there is no criteria of “required hours of performance” listed to determine what constitutes a passing score.
And what constitutes passing can be relative. First signs of substrate corrosion? Up to a given number of spots over a given surface area? Up to a given percent of the surface area exposed? All are important considerations that need to be defined before passing judgment on whether an EN deposit will pass or fail salt spray porosity testing.
Salt-Spray Testing
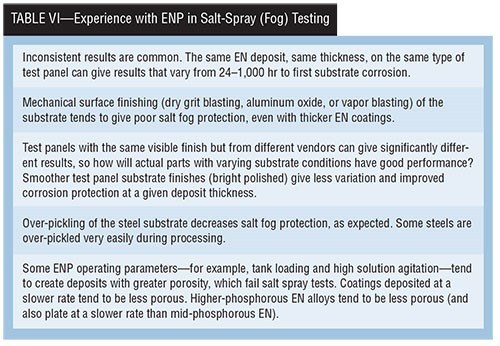
Many industry experts argue against use of salt-spray testing—specifically ASTM B 117—to evaluate the corrosion resistance of nickel coatings on steel, copper, aluminum or other materials where nickel is cathodic. A summary of more relevant concerns is found in Table VI.
Commonly used test results can be misleading regarding how an EN deposit will perform in corrosion tests. ASTM B 733-97 recognized this deficiency and eliminated salt-spray testing even as a porosity test in later document revisions.
Ultimately, it was recognized that neutral salt fog spray was not very corrosive to nickel, so there was no advantage in specifying the test. If specified, it should be agreed upon that in the best case, a salt-spray test is better suited as a porosity test. The argument then becomes that there are much simpler, faster tests that exist, and many of these choices are outlined in ASTM B 733-09. Unfortunately, many OEM specs continue to abide by the belief that salt spray is a good corrosion resistance test.
That aside, the salt spray performance of EN is a direct function of the resulting deposit porosity. While many have studied the factors that influence porosity, it has been shown that increasing nickel thickness improves corrosion protection. For a given thickness, however, the degree of substrate protection is influenced by many variables, ranging from its original surface condition to post-plating practices and every step between. Some recent work to investigate the impact of surface finish on the corrosion protection of EN deposits is demonstrated in the following data.
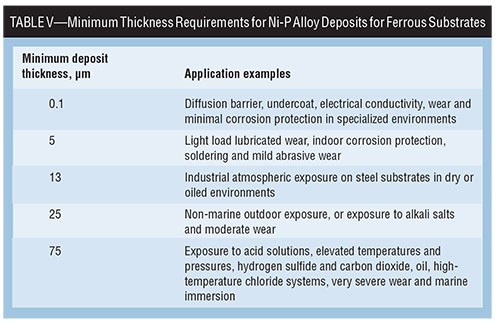
Because the presence or degree of porosity in the EN deposit will affect corrosion performance, ASTM B 733 and ISO 4527 provides a good source of information regarding minimum coating thickness requirements for EN deposits in various service conditions. Table V correlates Ni-P alloy thickness requirements with intended applications.
High-Phosphorus Alloys Less Porous
Experience has shown that since higher phos alloys have less porosity overall and where thinner deposits are required, a > 10-percent P alloy will tend to out-perform a 7-percent P alloy. In all cases, increasing deposit thickness improves the neutral salt spray performance relative to porosity, as shown with a study of the impact of surface finish versus EN type in Table VIII.
Since most of the commercialism of EN systems began in the 1960s, finishing shops using the technology installed various size tanks to plate EN finishes on parts of many sizes and configurations. These pioneers experienced the reality of solution life limitations.
The conventional EN chemistry still defined as standard today is a 6 g/L nickel solution that uses from 25 g/L or higher sodium hypophosphite as the reducing agent, resulting in the formation of the Ni-P alloy deposit.
There are many types of electroless nickel baths, however, acid nickel sulfate/sodium hypophosphite baths are commonly recognized as standard or conventional. One commonly accepted mechanism for the reduction and deposition of nickel in a hypophosphite reduced bath is as follows:
NiSO4 + H2O → Ni++ + SO4 = + H2O (1)
NaH2PO2 + H2O → Na+ + H2PO2- + H2O (2)
Ni++ + H2PO2- + H2O → Nio + H2PO3- + 2H+ (3)
(CATALYST)
H2PO2- + H2O → H2PO3- + H2↑ (4)
Equations 1 and 2 simply show the dissociation of the nickel salt and sodium hypophosphite in water. Sulfate and sodium are the byproducts of these two reactions that build up with usage. Equation 3 shows the reduction of the nickel ion by hypophosphite to form nickel metal on the parts and an orthophosphite anion, which is another major byproduct. Equation (4) shows a parallel reaction of hypophosphite with water to form orthophosphite and hydrogen gas. The hypophosphite to metal ratio varies with proprietary systems and is consumed in a given ratio to the nickel metal concentration. Typically for high-phosphorus (10–13 percent) baths, the efficiency is 5.6 g of hypo consumed for every 1 g of nickel deposited. For medium phosphorus (7–9 percent) baths, 5 g of hypo are consumed for every 1 g of nickel. For the low-medium phosphorus (4–6 percent) systems, 4.2 g of hypo are consumed for every 1 g of nickel deposited.
From the byproducts produced perspective for every 1 g of nickel metal plated, 3.9 g of orthophosphite ion (5.0 g as sodium orthophosphite), 1.64 g of sulfate, and 1.1 g of sodium are produced, and remain in the plating bath as the solution ages.
A Self-limiting Process
The buildup of these major byproducts over the course of the bath life is the primary reason EN is a self-limiting process. This buildup, specifically of sodium orthophosphite, but other constituents as well, increases the density of the solution at a rapid rate that eventually causes a reduction in the solubility of other components. When the total dissolved solids, as measured by specific gravity, reaches 1.28 g/mL or higher, deposit problems and solution problems are the result.
The increase of sodium orthophosphite also reduces the deposition rate of the bath. As these orthophosphite levels increase, the deposit smoothness, brightness, plating rate and adhesion can be negatively affected, resulting in roughness, pitting or porosity of the deposit.
Typical sodium orthophosphite levels at the end of a bath life vary depending upon many factors. Most EN systems being replenished with 30 g/L sodium hypophosphite per metal turnover produce 35–36 g/L of anhydrous sodium orthophosphite. For every 1 g of sodium hypophosphite consumed, 1.2 g of anhydrous sodium orthophosphite will be produced. The steady increase of orthophosphite content can easily be monitored by measuring the specific gravity of the solution at a constant temperature or by titration analysis. Solution loss has a positive impact toward extending the EN solution life.
This finite solution life requires the EN plating solution be discarded after plating as little as 36–48 g/L of nickel metal, representing 6 to 8 metal turnover (MTO), unless using some type of life extension strategy. This is confirmed in the lab, where operating a 1 L bath of EN chemistry under a controlled protocol exposes the myth of being able to obtain more than eight metal turnovers.
It’s always important to qualify the meaning of MTO with each type of chemistry being used. Here, for a standard-type nickel chemistry, a MTO represents every time 6 g/L of nickel is replenished back to the bath. Traditionally without EN solution losses, from 36 to 48 g/L of nickel is plated from a conventional system. Today, with low ionic strength chemistry , an MTO can be much different when a 3 g/L chemistry can easily achieve a life of 16 MTOs, which on the surface appears to be extraordinary. With the fifth generation EN chemistry, low ionic strength systems have been verified to plate over 54 g/L of nickel metal out of solution, which represents 18 MTOs but in correlating EN life accurately, it’s better to equate MTO to nickel metal plated from a bath instead of what is simply added back to the tank. This longer life is one recognized benefit of these new generations of low ionic strength EN chemistry systems.
For any EN chemistry, unless these byproducts are removed either through solution dragout, bleed and feed methods or by using membrane or electrodialysis technology to extend the life, there is no turning back on making up a new standard, 6 g/L chemistry solution at about every eight MTOs, or possibly 10–12, given the right circumstances of solution loss or high dragout.
But without life extension chemistry or equipment, there’s little hope to achieve 30 MTOs or more. There are long life chemistries available in the market that use alternative sources of nickel metal salts, including nickel-hypophosphite and nickel acetate that can achieve higher solution life. Of course, every option needs to be weighed cost versus performance.
High Amorphous Is Preferred
It’s already been shown that a higher degree of amorphous character in the EN deposit is preferred for optimum corrosion resistance performance. So any material added to an EN system—either by design or as a contaminant—that alters the EN micro-structure by creating a less amorphous character will impact corrosion performance.
For example, certain functionalized organic additives, such as thiourea and other sulfur additive types, increase the crystalline character of the deposit. This results in increasing deposit porosity and thus a reduction in corrosion protection. Only a very few organic additives result in a more amorphous deposit structure, but in general, adding certain types of sulfur-bearing organic additives to a high-phosphorus EN is detrimental.
Surface active agents (SAAs) are another class of functionalized organic molecule that can improve the properties of EN films and assist with plating of very thick, pit-free EN deposits (>25 µm). SAAs function by reducing the interfacial surface tension between the catalytic surface and the EN solution—increasing the wettability of the substrate.
Lower surface tension minimizes adsorption of particulates, hydrogen gas, and colloidal impurities, reducing the amount of micro-defects in the deposit. To perform effectively, the SAA must be compatible with the EN solution chemistry; it must not separate from the solution at operating temperature, foam or break down on prolonged heating.
Small amounts of SAAs can reduce micro-pitting and improve corrosion resistance. The most common types used in EN formulations are non-ionic or anionic; cationic surfactant types are generally avoided.
One study of the effect that surfactants have on properties of a high-phos nickel formulation (10 percent P) evaluated nine different surfactants with varying structures and charges. It found that, at very low concentration ranges, the deposition rate of the EN solution could be increased by 25 percent compared with the surfactant-free solution.
Reduction in Micro-pitting
The same study also reported a significant reduction in deposit micro-pitting while the corrosion resistance was enhanced, particularly when the resulting deposit was exposed to an acidic environment. A low concentration of a polyoxyethylene sorbitol ester non-ionic surfactant in a plating bath resulted in 60 percent less deposit weight loss compared with the bath with no surfactant after exposure to 10 wt% hydrochloric acid for 16 days.
Understanding surfactant impact on deposit micro-structure and corrosion rates is an important formulation objective in order to produce smooth, uniform, defect-free deposits with the smallest possible number of phase boundaries in the micro-structure.
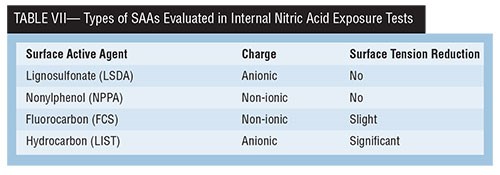
Four types of SAAs investigated in an internal study at Coventya have been found to significantly reduce micro-pits. The study also evaluated both high and low solution agitation because of the potential impact of solution dynamics on EN corrosion performance. Table VII shows the SAAs evaluated, their charge and their relative surface tension reduction.
EN deposits plated from solutions containing these SAAs underwent corrosion testing by exposure of test coupons to 50 wt% nitric acid, and a measure of their weight loss was observed. Addition of the lignosulfonate SAA resulted in the lowest weight loss at low solution agitation but also the highest weight loss with high solution agitation. From a formulation standpoint, this would be unacceptable, because solution movement variability exists in most EN installations. The hydrocarbon anionic SAA type is shown to have the best overall nitric acid corrosion performance, and would be chosen to improve deposit microstructure without negatively impacting acid corrosion resistance.
Carefully selecting the proper organic additive can offer benefits to EN deposits. Limiting exposure of the EN plating solution to organic contaminants is also critical to assure the maximum corrosion performance
EN chemistries provide viable options today and in the future for overcoming problems in the metal finishing industry. To pursue and commercialize the innovations, it is important that we collectively view today’s challenges as tomorrow’s opportunities.
RELATED CONTENT
-
Blackening of Ferrous Metals
The reasons for installing an in-house cold blackening system are many and varied.
-
Cleaning, Pretreatment to Meet Medical Specs ISO 13485 or FDA 21 CFR820
Maximilian Kessler from SurTec explains new practices for industrial parts cleaning, metal pretreatment and decorative electroplating in the medical device industry.
-
Stripping of Plated Finishes
The processes, chemicals and equipment, plus control and troubleshooting.


