
NASF/AESF Foundation Research Project #121: Development of a Sustainability Metrics System and a Technical Solution Method for Sustainable Metal Finishing: 5th Quarterly Report
The NASF Research Board has funded a research grant at Wayne State University on sustainability in the surface finishing industry, under the direction of Professor Yinlun Huang. The objective of the work is to create a surface-finishing-specific sustainability metrics system to measure economic, environmental and social sustainability. In this report, he describes how such a tool can work to benefit our industry. The reader is invited to contact Dr. Huang in identifying plating shops willing to participate in this program; it is not too late.
#surfin #nasf #sustainability
Share
by
Yinlun Huang*
Department of Chemical Engineering and Materials Science
Wayne State University
Detroit, Michigan, USA
Editor’s Note: This NASF-AESF Foundation research project report covers the fifth quarter of project work (April-June 2021) at Wayne State University in Detroit. A printable PDF version of this report is available by clicking HERE.
Featured Content


The success of this project depends on data. The data needed comes from industry and other stakeholders. The reader is encouraged to complete the survey form discussed in this report. It is available HERE and can be submitted to Dr. Huang at yhuang@wayne.edu.
Overview
It is widely recognized in many industries that sustainability is a key driver of innovation. Numerous companies, especially large ones that made sustainability as a goal, are achieving clearly a more competitive advantage. The metal finishing industry, however, is clearly behind others in response to the challenging needs for sustainable development.
This research project aims to:
- Create a metal-finishing-specific sustainability metrics system, which will contain sets of indicators for measuring economic, environmental and social sustainability,
- Develop a general and effective method for systematically sustainability assessment of any metal finishing facility that could have multiple production lines, and for estimating the capacities of technologies for sustainability performance improvement,
- Develop a sustainability-oriented strategy analysis method that can be used to analyze sustainability assessment results, identify and rank weaknesses in the economic, environmental, and social categories, and then evaluate technical options for performance improvement and profitability assurance in plants, and
- Introduce the sustainability metrics system and methods for sustainability assessment and strategy analysis to the industry.
This will help metal finishing facilities to conduct a self-managed sustainability assessment as well as identify technical solutions for sustainability performance improvement.
Progress Report (Quarter 5)
1. Student participation
Abdurrafay Siddiqui, a Ph.D. student, has been guided by the P.I. to work on the project. His research activities are reflected in Section C of this report. As a note, Mr. Siddiqui is a recipient of the 2021 AESF Student Scholarship.
2. Scheduled project tasks for Quarter 5
The main technical tasks for this quarter are listed below:
(1) To seek AESF’s support in distribution of a survey form on the Sustainable Metrics System for the Metal Finishing Industry to industrial experts and then to collect industrial feedback on the suitability of indicators in the metrics system.
(2) To perform a statistical analysis on the industrial feedback. After that, the PI’s team would contact a number of metal finishing facilities for possible collaboration, mainly for data collection and analysis.
(3) To continue the development of a sustainability decision-making method. A number of theoretical challenges, especially those related to data and information uncertainty, and approaches for addressing the challenges are to be studied.
3. Project activities and progress
3.1 Case study of an AHP-based sustainability assessment - How it works
3.1.1 Sustainability indicator selection and assessment, and graphic presentation.
Although we have not obtained industrial feedback on the proposed sustainability metrics system and thus no new plant data are available for case study, the PI guided the student to conduct an extensive literature survey, including a large number of papers published by the PI’s group, as well as the PI’s industrial experience (in two plating plants) in the past two decades. We have generated five sets of data suitable for a limited case study, as currently, the data are only adequate for evaluating a set of 13 sustainability indicators (out of 31 that were listed in the previous Quarterly Report).

Table 1 - Selected indicators and value normalization.
In Table 1, the first column lists all the selected indicators, including four economic indicators (E1 – E4), six environmental indicators (V1 – V6), and three social indicators (L1 – L3). The collected data is listed in the second column. These data are normalized to the range of [0, 1]; they are dimensionless, based on the maximum data range shown in the last two columns in the table. The assessment results using these indicators are plotted in the radar charts shown in Fig. 1 (see the blue-line polygons).
The assessment results using these indicators are plotted in the radar charts shown in Fig. 1.

Figure 1 - Indicator-based performance assessment: (a) economic sustainability, (b) environmental sustainability, and (c) social sustainability.
3.1.2 Sustainability Assessment Model
In the last report, we described a set of mathematical formulas for calculating sustainability values in the economic (E), environmental (V), and social (L) categories, as well as the overall sustainability (S) value. These formulas are listed below:
where Ei, Vj, and Lk are individual normalized indicators;

NE, NV and NL are the total numbers of selected indicators in different sustainability categories; ai, bj and ck are weighting factors associated with different indicators; α, β and γ are weighting factors associated with the categorized sustainability, E, V and L, respectively.
3.1.3 Weighting factor derivation
We applied the Analytic Hierarchy Process (AHP) method to calculate the values of 13 weighting factors assigned to the selected sustainability indicators. The results are summarized in Table 2. As a note, by this method, each weighting factor can have a value between 0 and 10, and the sum of the weighting factor values in the same sustainability category, is set to 10. Thus, the weighting factors are comparable only within the same sustainability category.
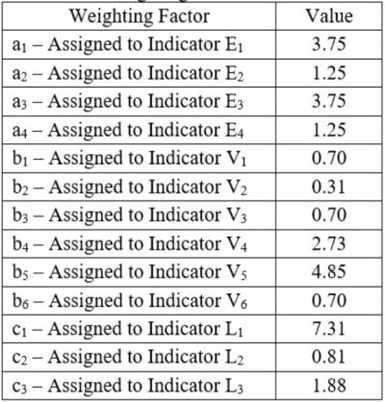
Table 2 - Weighting factors and values.
Table 2 - Weighting factors and values.
3.1.4 Categorized sustainability performance evaluation and graphic presentation
Using Equations 1 thru 3, we obtain the following categorized sustainability values: the economic sustainability (E) of this plant is 0.68, the environmental sustainability (V) is 0.87, and the social sustainability (L) is 0.66. Using Equation 4, the total sustainability (S) of the plant is found to be 0.74. Note that the normalized value range is set to [0, 1], with 0 for the lowest level of sustainability and 1 for the highest level of sustainability. As can be understood, the plant has reached a high level of environmental sustainability, and a good level of economic and social sustainability. The overall sustainability (S) shows that the plant is just below the 25th percentile in terms of full sustainability. This can be visualized using a Sustainability Cube Graph, such as is shown in Fig. 2.
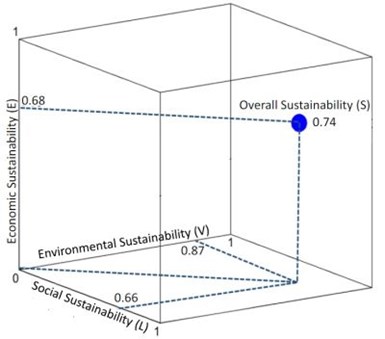
Figure 2 - Sustainability assessment result: categorized and overall sustainability performance.
3.1.5 Analysis and findings.
The indicator-based evaluation in each sustainability category shown in Fig. 1 provides detailed information of the plant performance, which facilitates the identification of improvement areas. For instance, for the economic sustainability, there is a slight improvement need reflected by indicators E3 (Net Profit Margin) and E4 (Net Profit Margin per Direct Employee). For the environmental sustainability, indicator V3 (Fraction of Water Recycled within Plant) needs to be very significantly improved. As a matter of fact, it seems that, for this indicator, the plant has almost the worst level of sustainability. Indicator V6 (Electricity Used per Dollar Product Sales) can also be slightly improved. And finally, for the social sustainability, indicator L3 (Working Hours Lost as a Percentage of Total Hours Worked) needs to be improved. This indicator also seems to have some of the worst levels of sustainability. Based on these analyses, the plant can focus on the identified areas for improvement.
Figure 2 provides an overview of the sustainability performance in three categories. This visualization should be valuable for those at the plant management level, who are interested in knowing where their company stands and in identifying a general improvement direction among three sustainability categories. They can also add goals to visualize how far they are from their goals and then develop solutions for improvement. The plant management can work with engineers to take a close look at the performance data presented in Fig. 1.
The methodology shown and applied in this case study is simple yet robust. It allows for a thorough analysis and identification of weak points in this plant. It also allows for effective determination of weight factors, which leads to more accurate calculations. This case study found, using industry data and chosen values, that the plant under study had relatively high sustainability. However, using the overall sustainability analysis, we were able to identify some weaknesses in the areas of economic and social sustainability. Using further analysis of the specific indicators used, we were able to find that there was room for improvement in the Net Profit Margin, Net Profit Margin per Direct Employee, and Electricity Used per Dollar Product Sales. There is also a significant improvement need for the Fraction of Water Recycled in the Plant and Hours Lost as a Percentage of Total Hours Worked. This identified the areas of water recycling and technology innovation with less need for maintenance to be the focus for this plant moving forward. Using this information, the plant has direction and can efficiently improve their sustainability in the future.
3.2 Training of Undergraduate Students
As stated, the undergraduate female students from SUNY Binghamton University and University of Maryland have been recruited for studying sustainability issues in the metal finishing industry. The research projects assigned to them are: (1) Sustainability Assessment of Electroplating Systems and Technical Solution Identification, and (2) Data-Driven Modeling and Analysis for Environmental and Energy Sustainability Improvement in Surface Finishing and Surface Coating. The main purpose of the projects designed is to train undergraduate students in identifying sustainability issues, analyzing data, conducting sustainability assessment, and developing solution methods for sustainability improvement. The two students are directly supervised by the PI and co-supervised by two Ph.D. students in the PI’s group. As part of the REU Summer Academy, the two students also join nine other students (working on other projects in nine engineering laboratories at Wayne State) to learn how to conduct research and develop communication skills. They take weekly lessons given by the PI and other faculty, and participate in seminars given by industrial experts, etc. Their research will end on August 10, 2021. The two students will participate in the REU research competition before the end of the summary academy. The PI will report their research results in the next reporting period of this project. Hopefully, these two undergraduate students will develop interests in working in the metal finishing industry in the future.
4. Plan for the 6th quarter of the project (7/1/21 – 9/30/21)
The PI plans to work with the AESF Foundation Research Board to develop effective approaches for conducting the industrial survey on the Sustainability Metrics System. One possible approach is to form a workgroup of about 10 industrial people. We could organize one or two group meetings and rank the sustainability indicators in the Metrics System.
The PI’s group also plans to further collect data for a more comprehensive sustainability study on five industrial cases and then make the methodology more general. In addition, the PI plans to guide his Ph.D. student to develop a computer-aided tool for sustainability assessment and performance analysis using MATLAB. If all is successful, one journal paper may be developed in September/October.
5. Attachment
The spreadsheet survey form, title “Evaluation of the Proposed Sustainability Metrics for Metal Finishing” is provided HERE.
6. Past project reports
1. Quarter 1 (April-June 2020): Summary: NASF Report in Products Finishing; NASF Surface Technology White Papers, 84 (12), 14 (September 2020); Full paper: http://short.pfonline.com/NASF20Sep1
2. Quarter 2 (July-September 2020): Summary: NASF Report in Products Finishing; NASF Surface Technology White Papers, 85 (3), 13 (December 2020); Full paper: http://short.pfonline.com/NASF20Dec1
3. Quarter 3 (October-December 2020): Summary: NASF Report in Products Finishing; NASF Surface Technology White Papers, 85 (7), 9 (April 2021); Full paper: http://short.pfonline.com/NASF21Apr1.
4. Quarter 4 (January-March 2021): Summary: NASF Report in Products Finishing; NASF Surface Technology White Papers, 85 (11), TBD (August 2021); Full paper: http://short.pfonline.com/NASF21Aug1.
7. About the authors

Dr. Yinlun Huang is a Professor at Wayne State University (Detroit, Michigan) in the Department of Chemical Engineering and Materials Science. He is Director of the Laboratory for Multiscale Complex Systems Science and Engineering, the Chemical Engineering and Materials Science Graduate Programs and the Sustainable Engineering Graduate Certificate Program, in the College of Engineering. He has ably mentored many students, both Graduate and Undergraduate, during his work at Wayne State.
He holds a Bachelor of Science degree (1982) from Zhejiang University (Hangzhou, Zhejiang Province, China), and M.S. (1988) and Ph.D. (1992) degrees from Kansas State University (Manhattan, Kansas). He then joined the University of Texas at Austin as a postdoctoral research fellow (1992). In 1993, he joined Wayne State University as Assistant Professor, eventually becoming Full Professor from 2002 to the present. He has authored or co-authored over 220 publications since 1988, a number of which have been the recipient of awards over the years.
His research interests include multiscale complex systems; sustainability science; integrated material, product and process design and manufacturing; computational multifunctional nano-material development and manufacturing; and multiscale information processing and computational methods.
He has served in many editorial capacities on various journals, as Co-Editor of the ASTM Journal of Smart and Sustainable Manufacturing Systems, Associate Editor of Frontiers in Chemical Engineering, Guest Editor or member of the Editorial Board, including the ACS Sustainable Chemistry and Engineering, Chinese Journal of Chemical Engineering, the Journal of Clean Technologies and Environmental Policy, the Journal of Nano Energy and Power Research. In particular, he was a member of the Editorial Board of the AESF-published Journal of Applied Surface Finishing during the years of its publication (2006-2008).
He has served the AESF and NASF in many capacities, including the AESF Board of Directors during the transition period from the AESF to the NASF. He served as Board of Directors liaison to the AESF Research Board and was a member of the AESF Research and Publications Boards, as well as the Pollution Prevention Committee. With the NASF, he served as a member of the Board of Trustees of the AESF Foundation. He has also been active in the American Chemical Society (ACS) and the American Institute of Chemical Engineers (AIChE).
He was the 2013 Recipient of the NASF William Blum Scientific Achievement Award and delivered the William Blum Memorial Lecture at SUR/FIN 2014 in Cleveland, Ohio. He was elected AIChE Fellow in 2014 and NASF Fellow in 2017. He was a Fulbright Scholar in 2008 and has been a Visiting Professor at many institutions, including the Technical University of Berlin and Tsinghua University in China. His many other awards include the AIChE Research Excellence in Sustainable Engineering Award (2010), AIChE Sustainable Engineering Education Award (2016), the Michigan Green Chemistry Governor’s Award (2009) and several awards for teaching and graduate mentoring from Wayne State University, and Wayne State University’s Charles H. Gershenson Distinguished Faculty Fellow Award.
Abdurrafay Siddiqui is a Ph.D. student at Wayne State University and has been guided by Prof. Yinlun Huang to work on the project.
*Dr. Yinlun Huang, Professor
Dept. of Chemical Engineering and Materials ScienceWayne State University
Detroit, MI 48202
Office: (313) 577-3771
E-mail: yhuang@wayne.edu
RELATED CONTENT
-
Black Chromium Finishing: Beauty and the Beast
Over the past 10 years, there has been commercial development of black chromium deposits from a trivalent chromium electrolyte. This paper will review the deposit characteristics and operational consideration of these similar, but different chromium plating deposits.
-
Electroplated Tin-Nickel Coatings as a Replacement for Nickel to Eliminate Nickel Dermatitis
This paper is a peer-reviewed and edited version of a paper delivered at NASF SUR/FIN 2013 in Rosemont, Ill., on June 12, 2013.
-
Troubleshooting Chromium Conversion Coatings on Aluminum
This paper provides processors with an extensive troubleshooting tool when conversion coating failures are encountered.


